Figure S3.
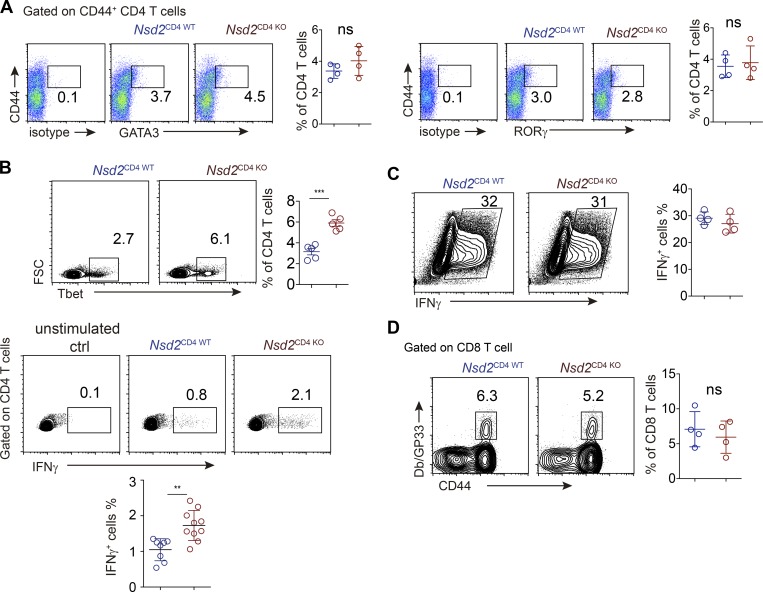
Th cell differentiation analysis. (A) Th2 and Th17 analysis of CD4 T cells from Nsd2CD4WT and NSD2CD4KO mice immunized with NP-OVA/Alum/LPS. (B) Th1 cell differentiation analysis by transcriptional factor staining (upper) or cytokine staining (lower) in splenic CD4+ T cells from NP-OVA/Alum/LPS immunized mice. For cytokine analysis, cells were restimulated with PMA/ionomycin for 4 h. (C) In vitro Th1 differentiation analysis. Sorted naive CD4+ T cells of indicated genotypes were stimulated with anti-CD3 and anti-CD28 in the presence of IL12 (10 ng/ml), IFNγ (10 ng/ml), and anti-IL4 (5 µg/ml) for 4 d. Cells were restimulated with PMA/ionomycin/GolgiPlug for 4 h before FACS staining for INFγ. Data are all representative of more than two experiments. (D) GP33-tetramer staining for splenic LCMV-specific CD8 T cells in mice infected with LCMV-cl13 10 d earlier. In all bar graphs, bars represent means, and dots represent individual mice. Error bars show means ± SD. Statistical analysis was done with Student’s t test. ns, not significant; **, P < 0.01; ***, P < 0.001. FSC, forward scatter.

