Figure 1.
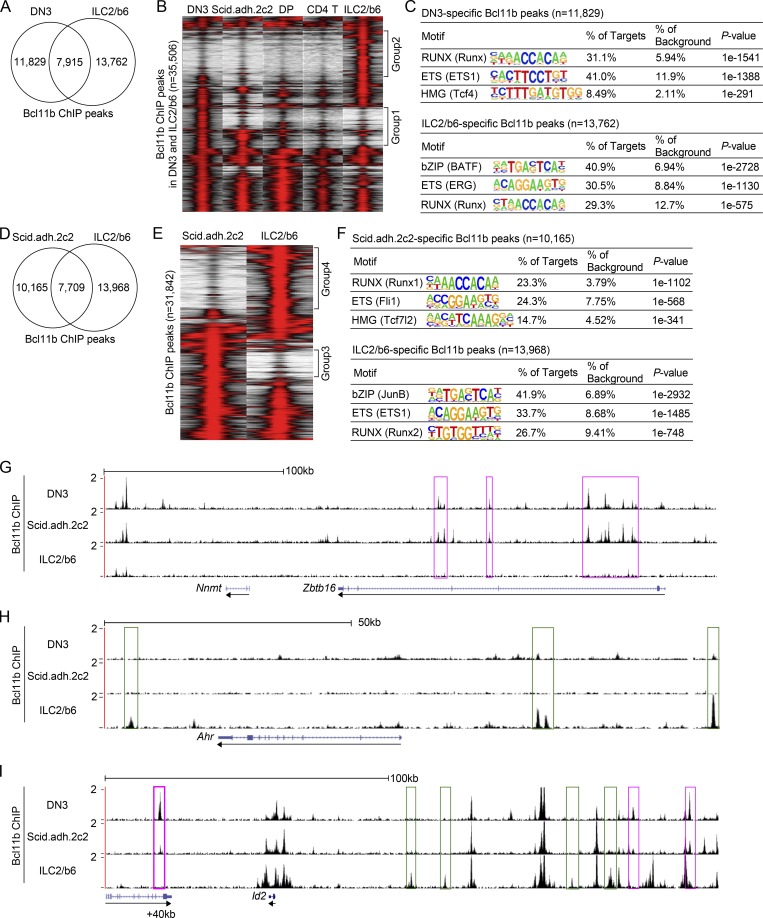
Bcl11b binds distinct regions across the genome in pro-T and ILC2 cells. (A) Bcl11b ChIP-seq analyses were performed using an ILC2 cell line, ILC2/b6. Venn diagrams show the number of Bcl11b ChIP peaks in ILC2/b6 and DN3 (Longabaugh et al., 2017) cells. (B) Tag count distributions for Bcl11b binding in DN3 (Longabaugh et al., 2017), Scid.adh.2c2, DP, CD4 T (Hu et al., 2018), and ILC2/b6 cells are shown. Each lane represents the merged tag directories from two biological replicates. All Bcl11b binding sites identified as reproducible in the DN3 and ILC2/b6 cells were included in the analysis. (C) The top three enriched sequence motifs of DN3-specific (top) and ILC2/b6-specific (bottom) Bcl11b peaks are shown. TF family names are shown for motifs, with specific HOMER position weight matrix names in parentheses. (D) Venn diagrams show the number of Bcl11b ChIP peaks in Scid.adh.2c2 and ILC2/b6 cells. (E) Tag count distributions for Bcl11b binding in Scid.adh.2c2 and ILC2/b6 cells are shown for reproducible Bcl11b sites, with each lane representing merged tag directories of two biological replicates. (F) The top three enriched sequence motifs of Scid.adh.2c2-specific (top) and ILC2/b6-specific (bottom) Bcl11b peaks are shown. (G–I) Representative binding profiles of Bcl11b in DN3, Scid.adh.2c2, and ILC2/b6 cells around Zbtb16 (G), Ahr (H), and Id2 (I) loci are shown. Pro-T–specific and ILC2-specific Bcl11b binding sites are labeled with magenta and green rectangles, respectively. Data are based on ChIP-seq peaks scored as reproducible in two replicate samples (A–F). Tracks shown are representative of two independent experiments (G–I).

