Figure 3.
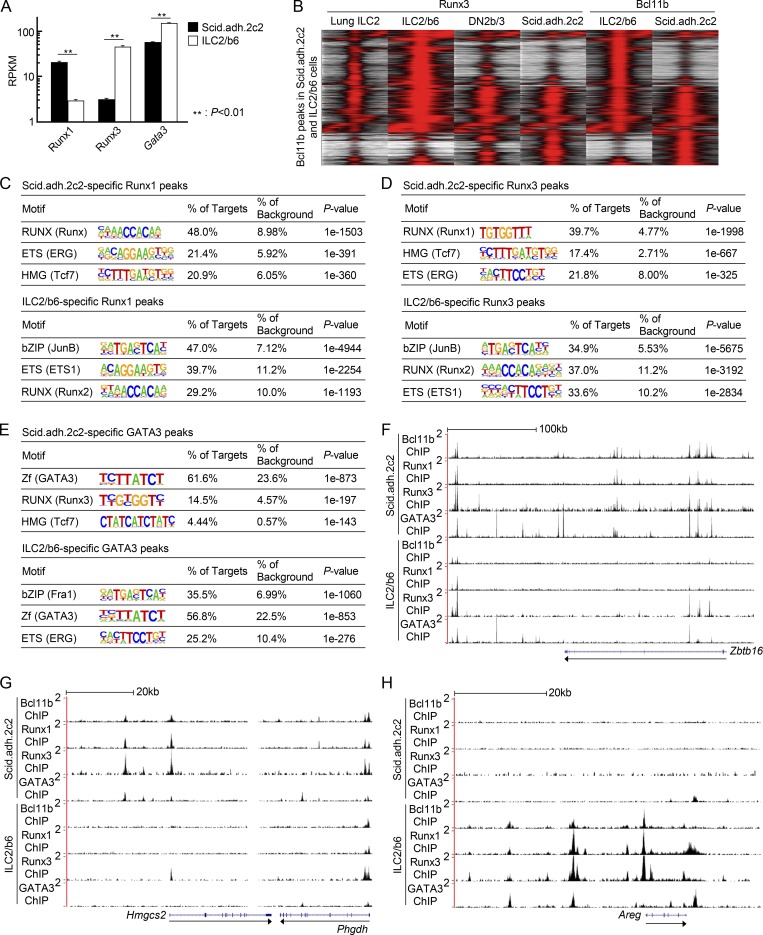
Distribution of Runx1, Runx3, and GATA3 binding sites across the genome in pro-T and ILC2 cells. (A) RPKM values for Runx1, Runx3, and Gata3 in Scid.adh.2c2 and ILC2/b6 cells are shown with SD. **, P < 0.01 by Student’s t test. (B) Tag count distributions for Runx3 and Bcl11b in activated primary lung ILC2, ILC2/b6, bone marrow precursor–derived DN2b/3, and Scid.adh.2c2 cells are shown. All Bcl11b binding sites identified in the Scid.adh.2c2 and ILC2/b6 cells were included in the analysis. Note that lung ILC2 data (GEO accession no. GSE111871) were generated using a different cross-linking protocol (Miyamoto et al., 2019). (C–E) The top three enriched sequence motifs of Scid.adh.2c2-specific (top) and ILC2/b6-specific (bottom) Runx1 (C), Runx3 (D), and GATA3 (E) peaks are shown. (F–H) Representative binding profiles of Bcl11b, Runx1, Runx3, and GATA3 in Scid.adh.2c2 and ILC2/b6 cells around Zbtb16 (F), Hmgcs2 (G), and Areg (H) loci are shown. Data are based on two replicate RNA-seq results (A) and are based on reproducible ChIP-seq peaks in two replicate samples (B–E), or are representative of results with replicate samples of each type generated from two independent experiments (F–H).

