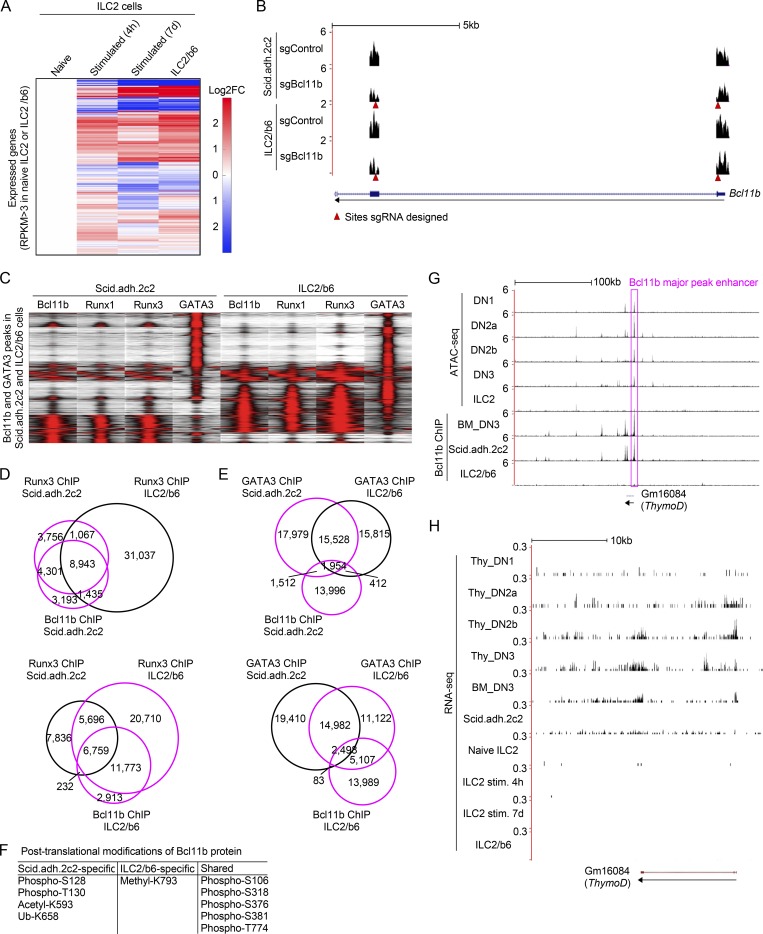
Figure S1.
Characterization of ILC2 and pro-T cell transcriptomes, Runx binding patterns, Bcl11b modifications, and activities in the Bcl11b enhancer region. (A) Heat maps show hierarchical clustering analyses of the expression of all expressed genes, which have RPKM >3 in naive ILC2 cells or an ILC2 cell line, ILC2/b6 cells, in naive ILC2, stimulated ILC2 for 4 h or 7 d (Shih et al., 2016; Yagi et al., 2014), and ILC2/b6 cells. (B) Representative RNA-seq tracks are shown for Bcl11b-deficient Scid.adh.2c2 or ILC2/b6 cells at the Bcl11b locus (around exon1 and 2). Red arrowheads show sites against which sgRNA was designed. (C) Tag count distributions for Bcl11b, Runx1, Runx3, and GATA3 in Scid.adh.2c2 and ILC2/b6 cells are shown. All Bcl11b and GATA3 binding sites identified in the DN3 and ILC2/b6 cells were included in the analysis. (D) Venn diagrams show the number of Runx3 ChIP peaks in Scid.adh.2c2 and ILC2/b6 cells with Bcl11b ChIP peaks in Scid.adh.2c2 cells (top) or ILC2/b6 cells (bottom). (E), Venn diagrams show the number of GATA3 ChIP peaks in Scid.adh.2c2 and ILC2/b6 cells with Bcl11b ChIP peaks in Scid.adh.2c2 cells (top) or ILC2/b6 cells (bottom). (F) Post-translational modifications of Bcl11b protein detected by mass spectrometry analysis are shown. (G) Representative ATAC-seq tracks for thymic DN subsets and mature small intestine ILC2 cells (Yoshida et al., 2019; downloaded from GEO accession no. GSE100738) and binding profiles of Bcl11b in DN3, Scid.adh.2c2, and ILC2/b6 cells are shown around the Bcl11b major peak enhancer (magenta rectangle) and ThymoD locus. The low activity state shown here in mature ILC2 cells contrasts with the state inferred to exist in ILC2 precursors, based on evidence in Fig. 5. (H) Representative RNA-seq tracks (mapped with STAR v2.4.0) at the ThymoD locus are shown for thymic DN subsets (Yoshida et al., 2019; GSE100738), in vitro cultured bone marrow precursor–derived DN3, Scid.adh.2c2, mature naive ILC2, mature ILC2 stimulated (stim.) for 4 h or 7 d (Shih et al., 2016; Yagi et al., 2014), and ILC2/b6 cells. Data from this study are based on two replicate RNA-seq results (A, B, and H) and are based on reproducible ChIP-seq peaks in two replicate samples (C–E and G).

