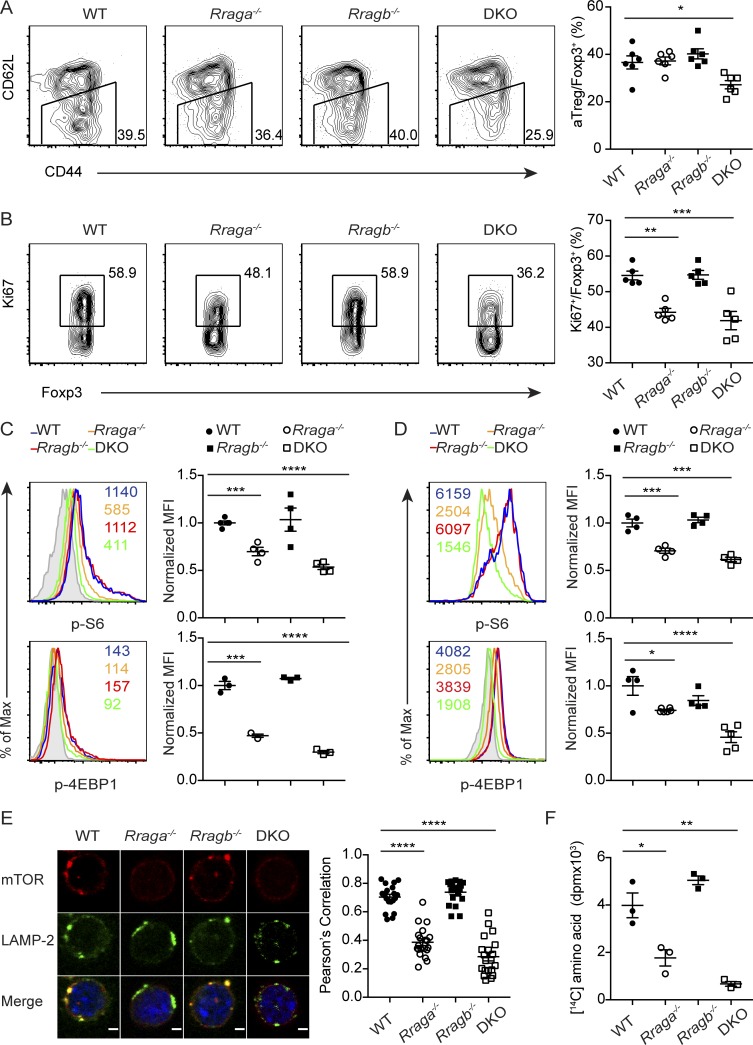
Figure 3.
Rag GTPases promote amino acid-induced mTORC1 signaling, amino acid anabolism, and aT reg cell proliferation. (A) Flow cytometric analysis of CD44 and CD62L expression in splenic T reg cells and quantification of frequencies of aT reg cells among total T reg cells of 9–12-d-old WT, Rraga−/−, Rragb−/−, and DKO mice (n = 6 mice per group). Data are pooled from three independent experiments. (B) Flow cytometric analysis and quantification of Ki67 expression in splenic T reg cells from 9–12-d-old WT, Rraga−/−, Rragb−/−, and DKO mice (n = 5 mice per group). Data are pooled from three independent experiments. (C and D) Flow cytometric analysis and quantification of p-S6 and p-4EBP1 in ex vivo (C) or 18-h–aT reg cells (D) from WT, Rraga−/−, Rragb−/−, and DKO mice. Numbers in graphs indicate MFI (n = 3–4 mice per group). Data are pooled from three independent experiments. (E) Immunofluorescence staining of mechanistic target of rapamycin (mTOR) and LAMP-2 in 18-h–aT reg cells from WT, Rraga−/−, Rragb−/−, and DKO mice. Original magnification, 63×; zoom of 2.5; scale bar, 2 µm. Quantification of colocalization between mTOR and LAMP-2 in T reg cells from four genotypes (n = 20 cells per group). Data are pooled from two independent experiments. (F) T reg cells from WT, Rraga−/−, Rragb−/−, and DKO mice were stimulated with α-CD3/28 and IL-2 for 18 h and pulse-labeled with L-[U-14C]-amino acid for another 6 h. The amount of radioactive amino acids incorporated into protein is shown (n = 3). Data are pooled from three independent experiments. Data in plots indicate mean ± SEM. *, P < 0.05; **, P < 0.01; ***, P < 0.001; ****, P < 0.0001 (one-way ANOVA with the Tukey post hoc test; A–F). Max, maximum.

