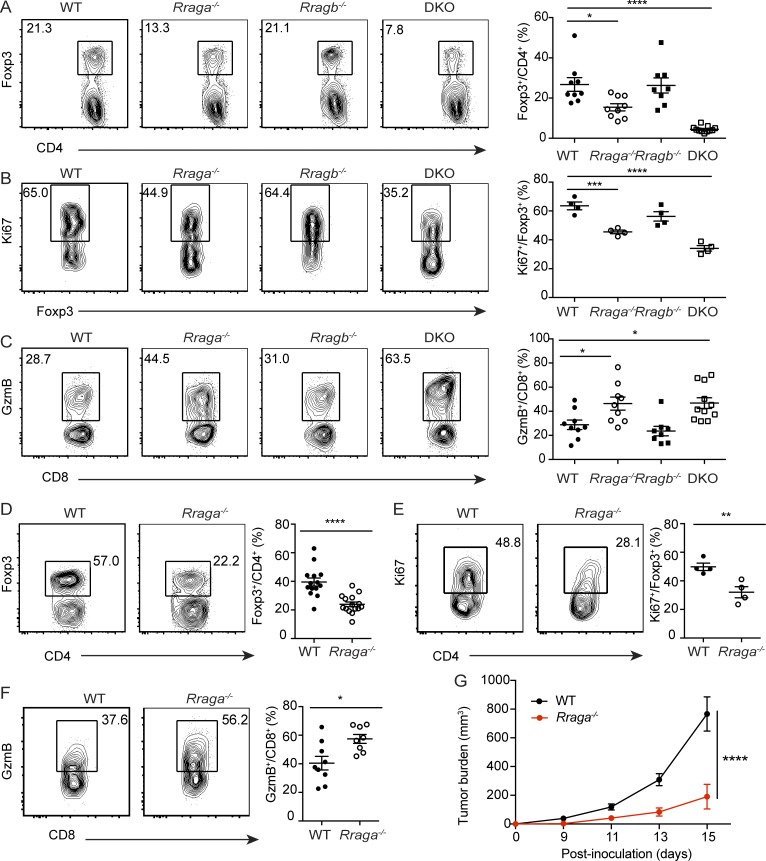
Figure 4.
Rag GTPases promote T reg cell generation in nonlymphoid tissues and tumor. (A) Flow cytometric analysis and quantification of Foxp3 expression in liver CD4+ T cells from 9–12-d-old WT, Rraga−/−, Rragb−/−, and DKO mice (n = 8–11 mice per group). Data are pooled from five independent experiments. (B) Flow cytometric analysis and quantification of Ki67 expression in liver T reg cells from WT, Rraga−/−, Rragb−/−, and DKO mice (n = 4 mice per group). Data are pooled from two independent experiments. (C) Flow cytometric analysis and quantification of GzmB expression in liver CD8+ T cells from 9–12-d-old WT, Rraga−/−, Rragb−/−, and DKO mice (n = 8–11 mice per group). Data are pooled from five independent experiments. (D–G) 6–8-wk-old WT or Rraga−/− mice received subcutaneous injection of B16 melanoma cells. (D) Flow cytometric analysis and quantification of Foxp3 expression in tumor-infiltrating CD4+ T cells from WT and Rraga−/− mice (n = 14–15 mice per group). Data are pooled from five independent experiments. (E) Flow cytometric analysis and quantification of Ki67 expression in tumor T reg cells from WT and Rraga−/− mice (n = 4 mice per group). Data are pooled from two independent experiments. (F) Flow cytometric analysis and quantification of GzmB expression in tumor-infiltrating CD8+ T cells from WT and Rraga−/− mice (n = 8 or 9 mice per group). Data are pooled from five independent experiments. (G) Tumor growth curves of WT and Rraga−/− mice are shown (n = 11 or 12 mice per group). Data are pooled from four independent experiments. Numbers in gates indicate percentage of cells. Data in plots indicate mean ± SEM. *, P < 0.05; **, P < 0.01; ***, P < 0.001; ****, P < 0.0001 (one-way ANOVA with the Tukey post hoc test [A–C], unpaired t test [D–F], and two-way ANOVA [G]).

