Figure S4.
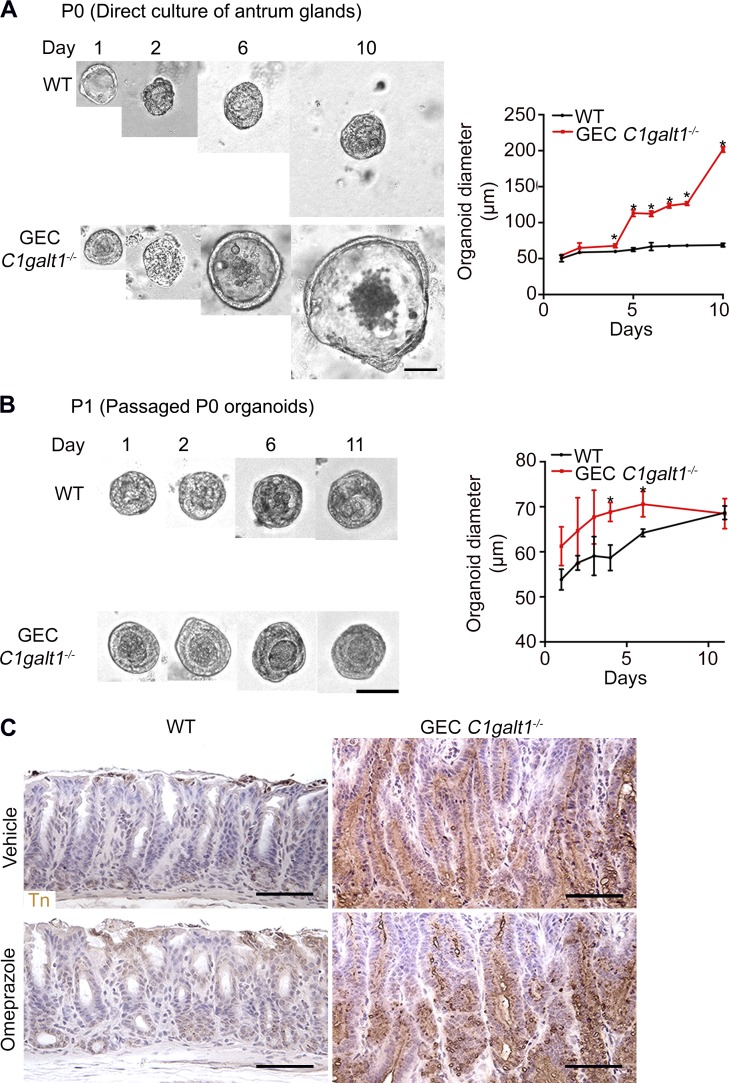
Effect of C1GalT1 loss on growth of primary antrum epithelial cells. (A) Representative antrum gland–derived organoids at successive days after culture. Graph shows measurement or gastric spheroid diameter (mean ± SD). *, P < 0.05. (B) Same as A, but analyzed after the first passage (P1). Results are representative of two independent experiments (mean ± SD). *, P < 0.05. (C) IHC staining of WT and GEC C1galt1−/− antrum with anti-Tn. Brown, positive staining. Scale bars, 50 µm.

