Figure 2.
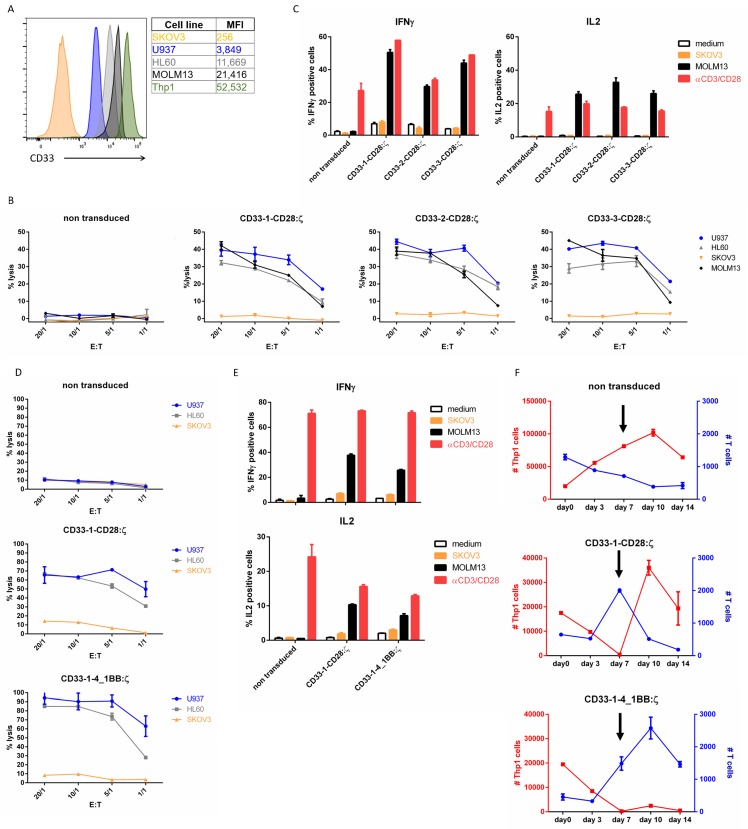
CD33-specific nanoCARs are functional: (A) CD33 surface expression on different target cell lines analyzed by flow cytometry. MFI represents median fluorescence index; (B) Cell lysis of CD33+ or CD33− target cells after 4 h of co-incubation with T cells expressing the CD33-CD28:ζ nanoCAR in different effector-target ratios (E:T). Reported values are the means of duplicate determinations with error bars indicating the standard error of the mean (SEM); (C) Cytokine production of nanoCAR T cells was analyzed by intracellular staining 5 h after co-incubation with CD33+ or CD33− target cells. Mean percentages of IFN-γ and IL-2 positive cells are shown, gated on eGFP+ cells. Error bars indicate the SEM; (D) Cell lysis of CD33+ or CD33− target cells after co-incubation with CD33-1-CD28:ζ or CD33-1-4_1BB:ζ nanoCAR T cells in different effector-target ratios. Reported values are the means of duplicate determinations. Error bars indicate the SEM; (E) Cytokine production of CD33-1-CD28:ζ or CD33-1-4_1BB:ζ nanoCAR T cells. Mean percentages of IFN-γ and IL-2 positive cells are shown. Error bars indicate the SEM; (F) Long-term in vitro stress test. NanoCAR T cells (blue) are incubated at very low (0.025:1) effector to target cell (red) ratios. Arrow indicates addition of fresh Thp1 cells at day 7. Error bars represent the SEM. The data are representative of two independent experiments with three different donors. Each experiment shown was performed two times with three different donors. Data shown are representative for these experiments.

