Figure 5.
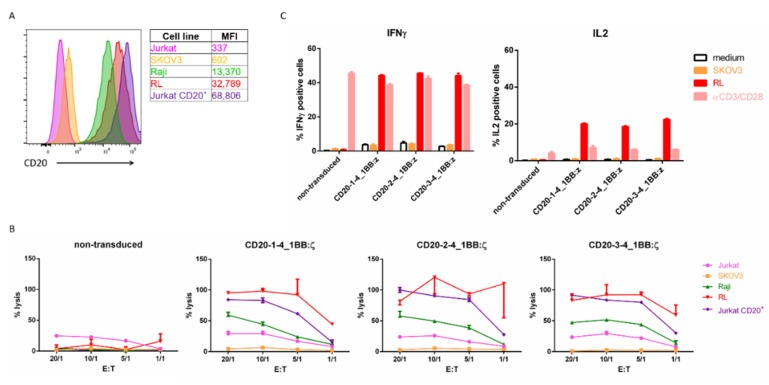
CD20 specific nanoCARs are functional: (A) CD20 surface expression on different target cell lines by flow cytometry. MFI represents median fluorescence index; (B) Cell lysis of CD20+ or CD20− target cells 4 h after co-incubation with T cells expressing CD20 nanoCAR in different effector-target ratios. Reported values are the means of duplicate determinations with error bars indicating the standard error the mean (SEM); (C) Cytokine production of nanoCAR T cells was analyzed by intracellular staining 5 h after of co-incubation with CD20+ or CD20− target cells. Mean percentages of IFN-γ and IL-2 positive cells are shown, gated on eGFP+ cells. Error bars indicate the SEM. Each experiment shown was performed two times with three different donors. Data shown are representative for these experiments.

