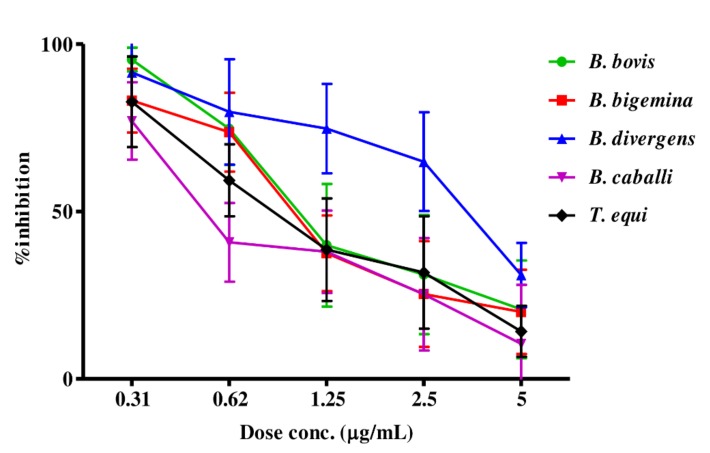
Figure 1.
Dose-response curves of MEBV against Babesia and Theileria parasites in vitro. The curves showing the correlation between the percentage of inhibition and the concentration of MEBV (µg/mL) on B. bovis, B. bigemina, B. divergens, B. caballi and T. equi. The values obtained from three separate trials were used to determine the IC50’s using the non-linear regression (curve fit analysis) in GraphPad Prism software (GraphPad Software Inc., La Jolla, CA, USA).

