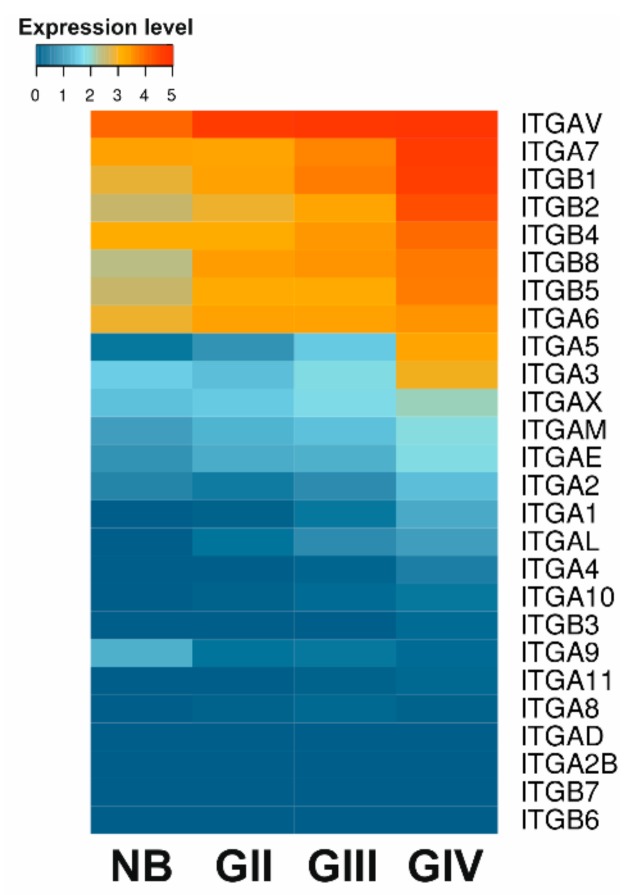
Figure 3.
Expression profile of major integrin subunits. Data from 5 normal brain (NB) samples, 248 WHO grade II (GII), 261 WHO grade III (GIII) and 160 glioblastoma (GBM) WHO grade IV (GIV) tumor samples were acquired from TCGA RNAseq repository as FPKM values, quantile normalized and log2 transformed. Mean expression values were compared.

