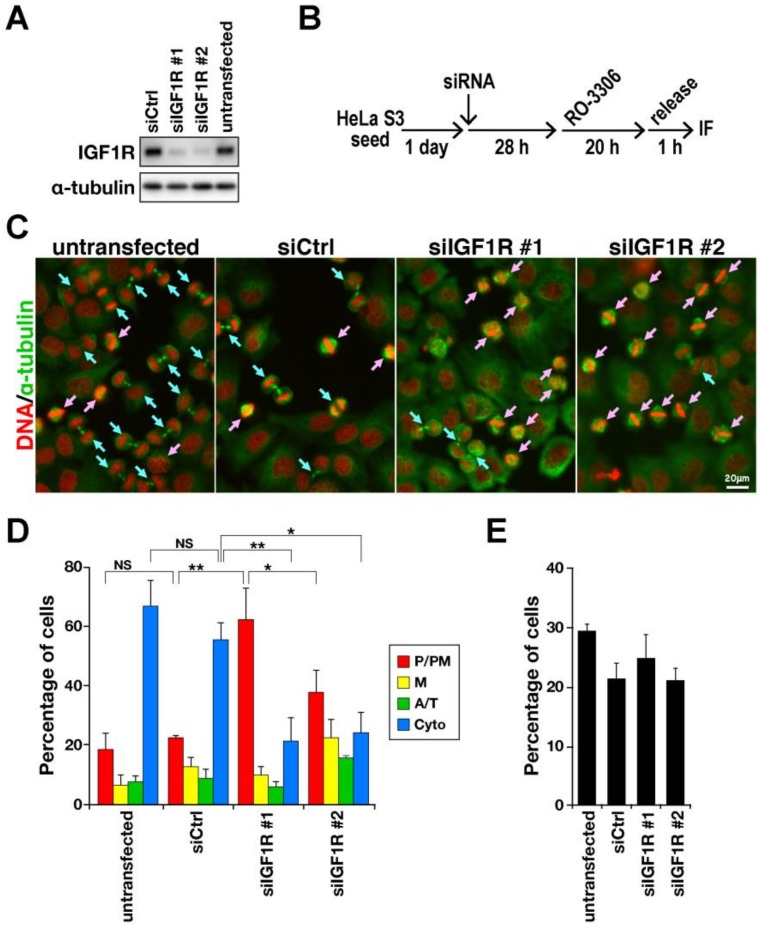
Figure 1.
IGF1R knockdown delays M-phase progression. (A) HeLa S3 cells were transfected with non-targeting siRNA (siCtrl) and siRNAs targeting IGF1R (#1, #2), and 48 h later, whole-cell lysates were analyzed by western blotting analysis with indicated antibodies. (B–E) HeLa S3 cells were transfected with non-targeting siRNA (siCtrl) and siRNAs targeting IGF1R (#1, #2). After 28 h, cells were treated with 6 µM RO-3306 for 20 h. After washing cells, the cells were incubated with prewarmed medium for 1 h and fixed, followed by immunofluorescence staining for DNA (red) and α-tubulin (green). M-phase cells were classified into four groups: cells in prophase and prometaphase (P/PM), metaphase (M), anaphase and telophase (A/T), and cytokinesis (Cyto). The ratio of M-phase cells among all cells was determined by examining more than 979 cells in each experiment. (B) A schematic depiction of the synchronization method is shown. (C) Representative images are shown. Pink and blue arrows indicate cells before and after anaphase onset, respectively. Scale bar, 20 µm. (D) The percentages of cells in each group are plotted as mean ± SD calculated from three independent experiments (n > 206 in each experiment). The asterisk indicates significant differences using Tukey–Kramer test. * p < 0.05, ** p < 0.01, NS, not significant. (E) The mitotic index is plotted as mean ± SD. There was no significant difference (Tukey–Kramer test).

