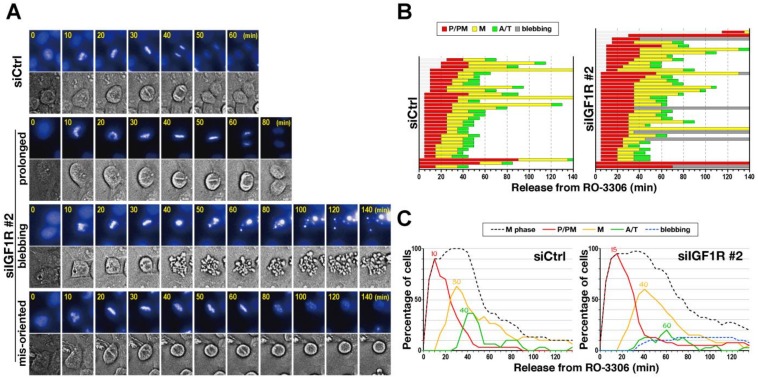
Figure 2.
Delay in chromosome alignment and anaphase onset. HeLa S3 cells were transfected with control siRNA (siCtrl) or siIGF1R (siIGF1R #2), and 28 h later, cells were treated with 6 µM RO-3306 for 20 h. Cells were released in the presence of 0.1 µM Hoechst 33342 to visualize DNA. M-phase progression was monitored every 5 min for 140 min by time-lapse imaging. (A) Representative images of cells showing normal M-phase, delayed progression, blebbing, and misorientation of the mitotic spindle are shown. (B) The duration of each mitotic sub-phase—prophase and prometaphase (P/PM, red), metaphase (M, yellow), anaphase and telophase (A/T, green), and blebbing cells (bleb, gray) for individual cells are shown (siCtrl, n = 32; siIGF1R, n = 40). (C) The percentages of M-phase cells (black), prophase and prometaphase cells (red), metaphase (orange), anaphase and telophase cells (green), and blebbing cells (blue) at the indicated times are plotted. The respective peak times for the ratios of sub-phases are shown in the graph.

