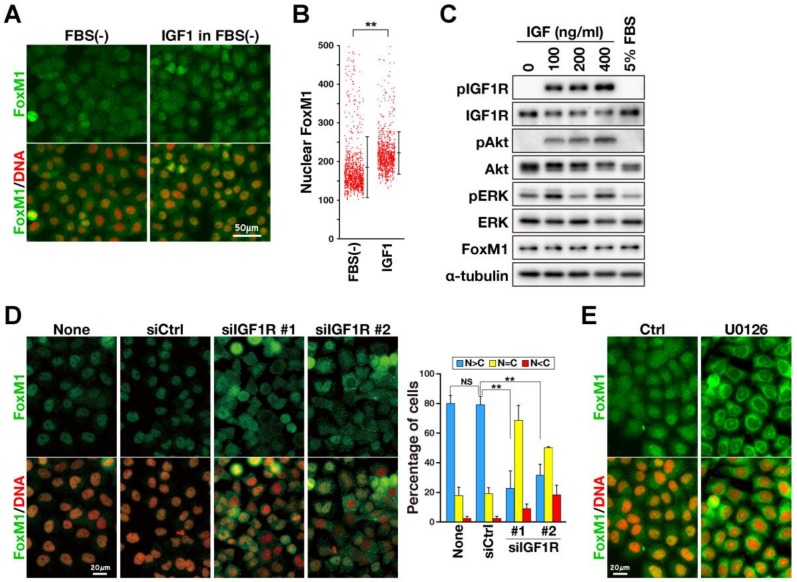
Figure 3.
IGF1R signal partially induce nuclear localization of FoxM1. (A, B) HeLa S3 cells were cultured with FBS-free medium for 24 h and then incubated in the presence of 0.1 µg/mL IGF1 for 24 h. The cells were fixed and stained for FoxM1 (green) and DNA (red). (A) Representative images are shown. Scale bar, 50 µm. (B) The fluorescence signals were analyzed by an image analyzer. Fluorescence intensities of nuclear FoxM1 in individual cells were plotted with the mean ± SD calculated from one experimental result (n > 930 in each experiment). Two independent experiments were performed and similar results were obtained. The asterisk indicates significant differences using Welch’s t-test. ** p < 0.01. (C) HeLa S3 cells were starved for 24 h and then treated with 100, 200, and 400 ng/mL of IGF1 for 3 h. Whole-cell lysates were prepared and analyzed by western blots with the indicated antibodies. (D) HeLa S3 cells were transfected with non-targeting siRNA (siCtrl) and siRNAs targeting IGF1R (#1, #2). After 48 h, cells were fixed with formaldehyde and staining for FoxM1 (green) and DNA (red). Cells were classified into three categories: (N > C), fluorescence in the nucleus is higher than that in the cytoplasm; (N = C), similar fluorescence intensity throughout the nucleus and cytoplasm; (N < C), fluorescence in the nucleus was lower than that in the cytoplasm. Results represent mean ± SD from three independent experiments (n > 233 in each experiment). The asterisk indicates significant differences using a Tukey–Kramer test. ** p < 0.01, NS, not significant. (E) HeLa S3 cells were treated with or without U0126 in serum-free culture medium containing 100 ng/mL of IGF1 for 24 h, fixed and stained for FoxM1 (green) and DNA (red). Scale bar, 20 µm.

