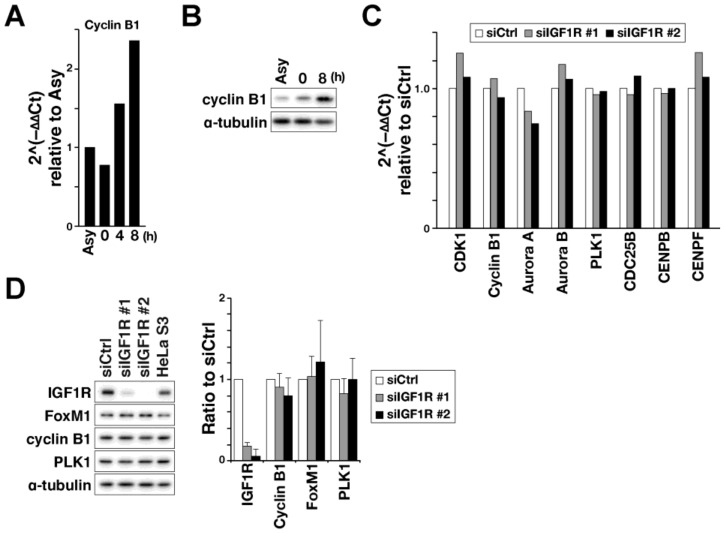
Figure 4.
FoxM1 target genes are not suppressed in IGF1R knockdown cells. (A, B) HeLa S3 cells were treated with 4 mM thymidine for 24 h, washed with prewarmed PBS(–), and then cultured with prewarmed medium for 4 or 8 h. (A) Asynchronized cells (Asy), cells treated with thymidine (0 h) and those released from thymidine treatment for 4 or 8 h were collected and analyzed for cyclin B1 mRNA by real-time PCR. (B) Asynchronized cells (Asy) and cells treated with thymidine (0 h) and those released from thymidine treatment for 8 h were collected and subjected to western blot analysis using indicated antibodies. (C) HeLa S3 cells were transfected with siCtrl, or siIGF1R #1 or #2 and treated 40 h later with 4 mM thymidine for 24 h. Cells were then washed, cultured with prewarmed medium for 8 h, and collected for real-time PCR analysis using TaqMan probes for M-phase regulators indicated in the figure. Fold changes in mRNA levels are expressed relative to siCtrl. (D) HeLa S3 cells were transfected with siCtrl or siIGF1R #1 or #2 and treated 16 h later with 4 mM thymidine for 24 h. Cells were then washed, cultured with prewarmed medium for 8 h, and collected for western blot analysis. Protein levels were quantified by measuring band intensities and relative ratios to siCtrl are plotted as mean ± SD calculated from three independent experiments. There was no significant difference (Steel–Dwass test).

