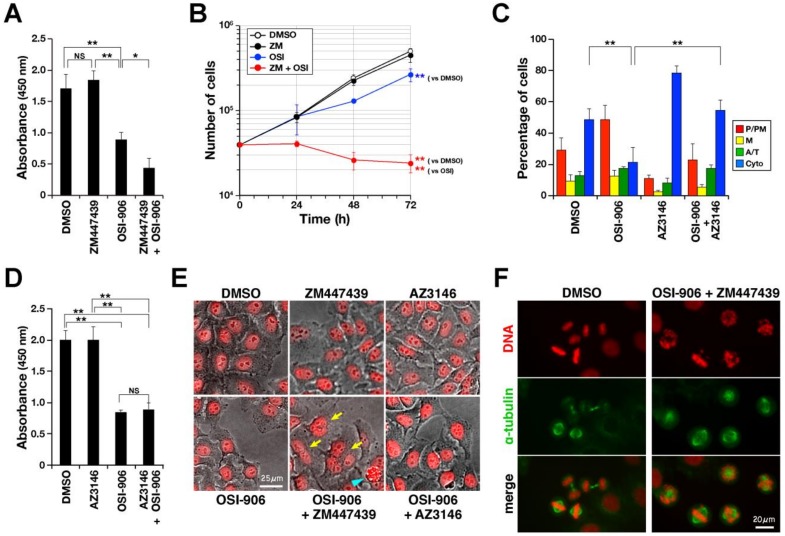
Figure 7.
IGF1R inhibitor synergizes with the Aurora B inhibitor to suppress cell proliferation. (A) HeLa S3 cells were treated with 3 µM OSI-906 alone or in combination with 1 µM ZM447439. The cell viability was assessed using WST-8. The mean ± SD of absorbance was calculated from three independent experiments. (B) HeLa S3 cells (20,000 cells) were seeded in a 24-well plate. The number of cells was counted every 24 h for three days and plotted. Statistical analysis was performed for comparison of the cell numbers at 72 h. (C) HeLa S3 cells were synchronized with RO-3306, and the M-phase progression was examined as described in Figure 5D using a combination of 10 µM OSI-906 and 2 µM AZ3146. The mean ± SD was calculated from three independent experiments (n > 204 in each experiment). (D) HeLa S3 cells were treated with 3 µM OSI-906 alone or in combination with 2 µM AZ3146. The cell viability was assessed as described in (A). (E) At 51 h after the addition of inhibitors or DMSO, cells were stained for DNA with 10 µM Hoechst 33342 (pseudo-colored red). After washing with PBS(–), cell images were captured. Yellow arrows indicate multinucleated cells. Blue arrowhead indicates dead cells. (F) HeLa S3 cells were synchronized with RO-3306. During the last 1 h of incubation with RO-3306 and the following 1 h of release, cells were treated with the combination of OSI-906 and ZM447439, and stained for α-tubulin and DNA. Tukey–Kramer multiple comparisons test was used to calculate p values (* p < 0.05, ** p < 0.01, NS, not significant).

