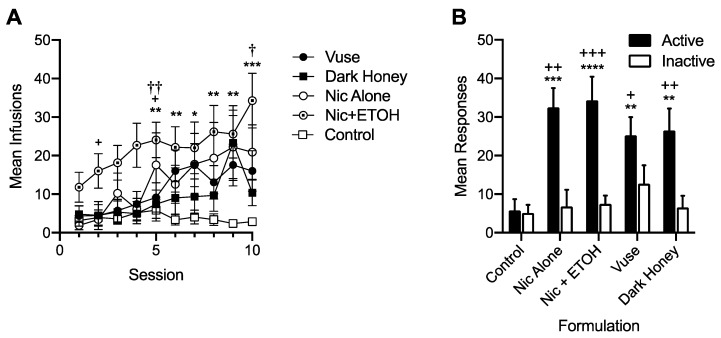
Figure 1.
Mean (± the standard error of the mean (SEM)) number of infusions earned per session during the first 10 sessions of the acquisition of self-administration (SA) (panel A) and at stability under the FR 1 schedule prior to demand assessment (panel B). Each point or bar represents the mean of 9–21 rats. Control is the combined mean of the groups with access to saline alone or saline + ETOH, which did not differ from each other. Because responses during the timeout are not included, the number of active lever responses is equal to the number of infusions for each formulation. Different from Control, * p < 0.05, ** p < 0.01, *** p < 0.001, **** p < 0.0001. Different from Dark Honey † p < 0.05, †† p < 0.01. Panel A: Different from Vuse + p < 0.05. Panel B: Different from Inactive + p < 0.05, ++ p < 0.01, +++ p < 0.001.

