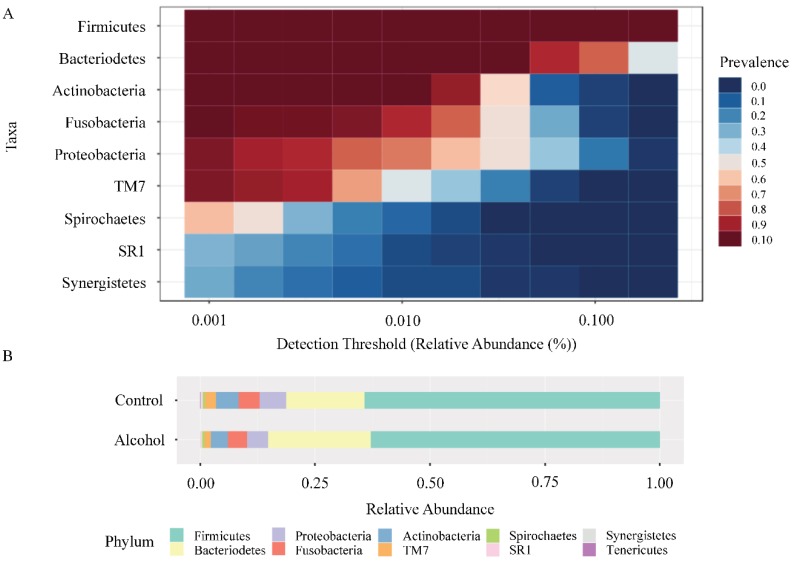
Figure 2.
Microbial communities identified at the phylum level. (A) Heatmap of the core microbiome analysis to identify core taxa at phylum level. A total of 49 samples are included in the visual representation of the taxonomic relative abundance at phylum level. The y-axis represents the prevalence level of core features across the detection threshold (relative abundance) range on x-axis. The variation of prevalence of each phylum is indicated by a gradient of color from blue (decreased) to red (increased). (B) Taxonomic composition of alcohol group and control group at the phylum level. Visual exploration to evaluate taxonomic composition of community through direct quantitative comparison of relative abundances was performed by using stacked bar chart.

