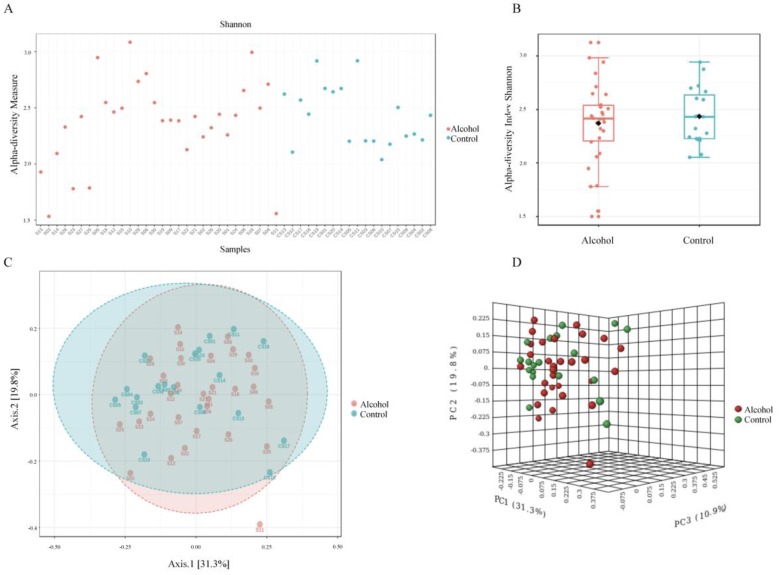
Figure 4.
Alpha and beta diversity profiling and significance testing. The Shannon alpha-diversity analysis at genus level was performed in filtered data input by using Mann–Whitney/Kruskal–Wallis statistical method. The samples (A) or the groups (B) were represented on x-axis and their estimated diversity on y-axis. Each sample or boxplot are colored based on alcohol consumption status (alcohol users = red, control = blue). The beta-diversity analysis at genus level by using the non-phylogenetic Bray–Curtis index distance method was using to stablish the changes in abundance of taxa present in the dataset. Principle coordinate analysis (PCoA) was used to visualize these matrixes in 2 (C) or 3-D plot (D). Each point in the graph (alcohol users = red, control = green) represents the entire microbiome analyses of a single sample. The statistical significance of the clustering pattern was evaluated by using Permutational MANOVA (PERMANOVA).

