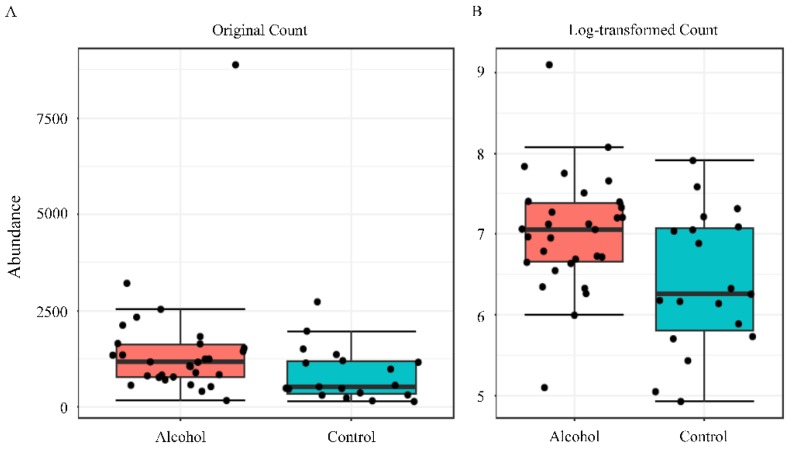
Figure 5.
Differential abundance analysis was performed to evaluate Prevotella genus by using univariate statistical composition. Each boxplot, which visualization are in original count (panel A) or log-transformed count (panel B), represents the abundance distribution of Prevotella genus. The Mann–Whitney/Kruskal–Wallis method with adjusted p-value cut-off of 0.05 was used to perform statistical analyses.

