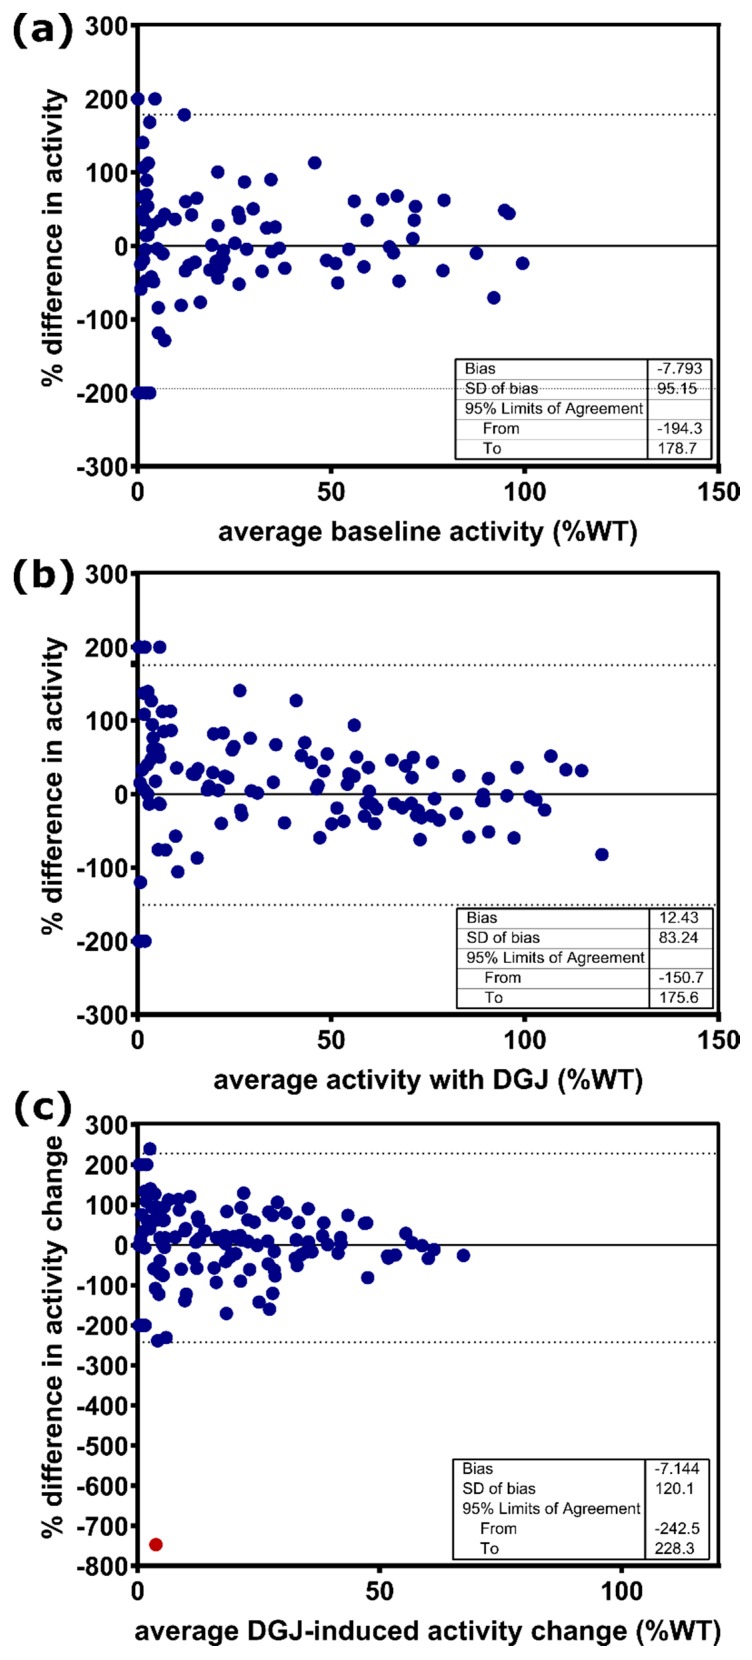
Figure 2.
Bland–Altman analysis of α-Gal A activity for GLA variants expressed as percentage difference in activity (%WT) between the in-house assay and the GLP-validated assay. (a) Baseline α-Gal A activity without the addition of DGJ. (b) α-Gal A activity with DGJ. (c) DGJ-induced α-Gal A activity change. The dotted line indicates the 95% limit of agreement. SD: standard deviation.

