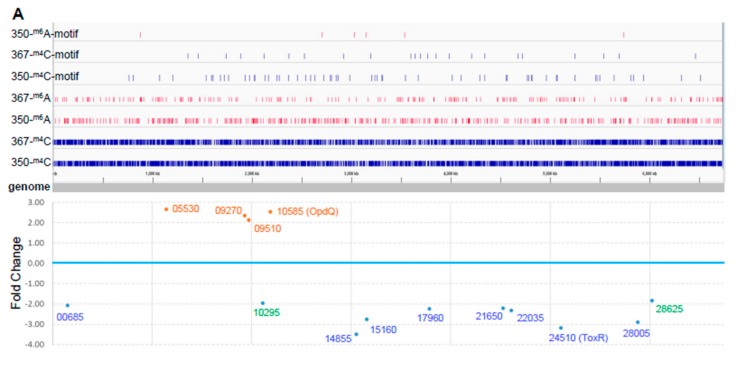
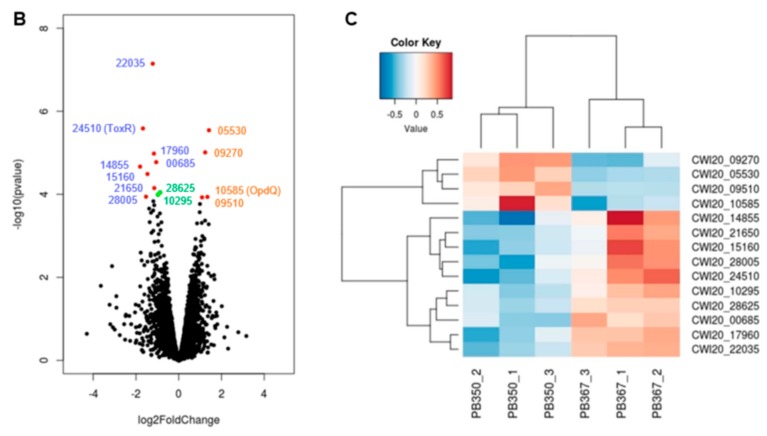
Figure 2.
Comparative epigenome and transcriptome analysis of P. aeruginosa isolates. (A) Genome-wide differential methylation and gene expression in the paired P. aeruginosa isolates, PB367 and PB350. Top: Differentially methylated adenosine (m6A, in red) and cytosine (m4C, in blue) in PB367 and PB350, within or without sequence motif (refer to Table 2), and their distribution throughout the whole genome. Bottom: 14 genes identified with significantly differential expression (adjusted p-value < 0.05) and their particular loci at the genome. Upregulated genes in PB350 are labeled in brown, downregulated in blue, fold change less than 2 are in green; (B) Volcano plot of RNAseq for identification of 14 genes with significantly differential expression; (C) Heatmap of genes with significantly differential expression in triplicated samples. The color key represents the amount by which each gene deviates in a particular sample from the gene’s average across all the samples.


