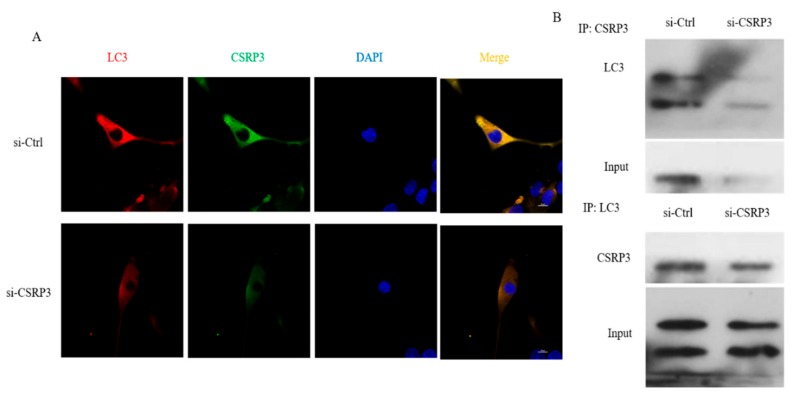
Figure 5.
Co-localization of CSRP3 and LC3 in chicken myoblasts. (A) Representative confocal microscopy images of LC3 (red) and CSRP3 (green) were shown; scale bar = 20 μm. (B) Reciprocal co-immunoprecipitation analysis between CSRP3 and LC3 in ctrl and CSRP3 siRNA cells. Data are expressed as mean ± SEM of three independent experiments.

