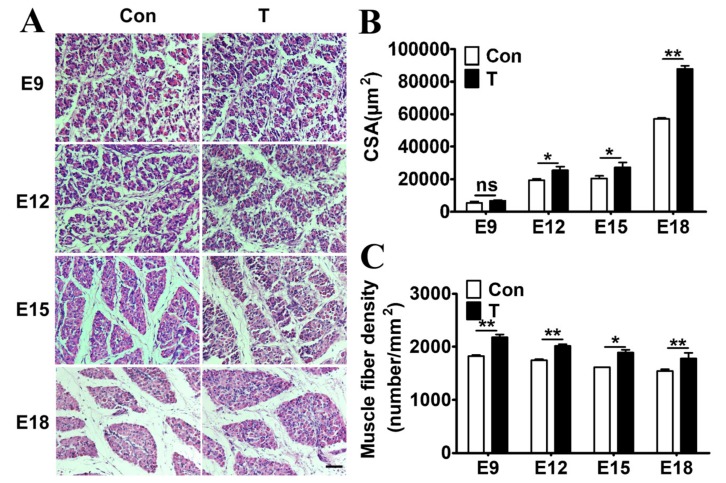
Figure 2.
Effect of T treatment on myofiber properties. (A): HE staining of paraffin sections of leg muscles at E9–E18. The cross-sectional area of myofibers (B) and myofiber density (C) was measured. Scale bar: 100μm. Data are presented as the means + SE. Asterisk (*) represents statistically different (p < 0.05). p < 0.01 is shown as **.

