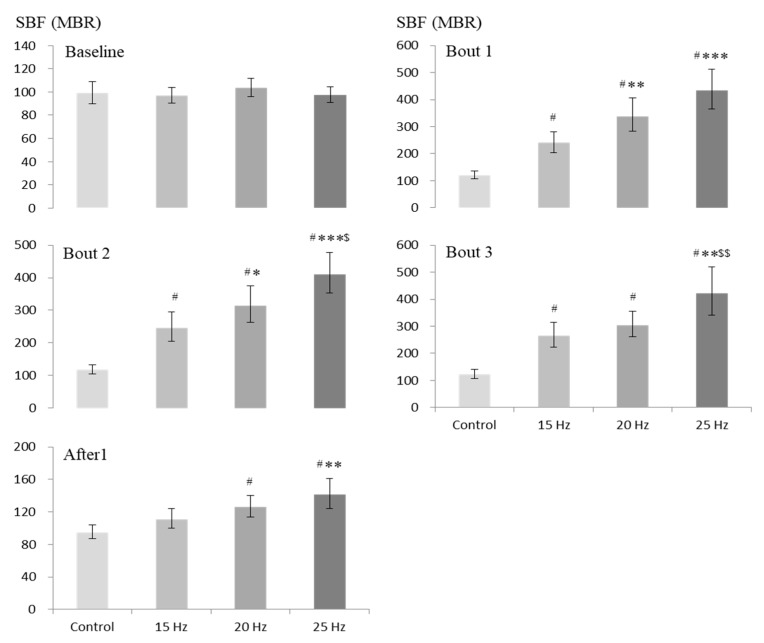
Figure 2.
Comparison of SBF (MBR) between 4 exposure conditions at baseline (before), during (bouts 1, 2 and 3), and after exposure (n = 30). Values are shown as geometric mean and 95% CI (shown as error bars). Levels of significant differences from the corresponding values by repeated measures ANOVA with adjustments for multiple comparisons by Bonferroni corrections: # p < 0.001 versus control; *** p < 0.001, ** p < 0.005 and * p < 0.05 versus 15 Hz; $$ p < 0.01 and $ p < 0.05 versus 20 Hz.

