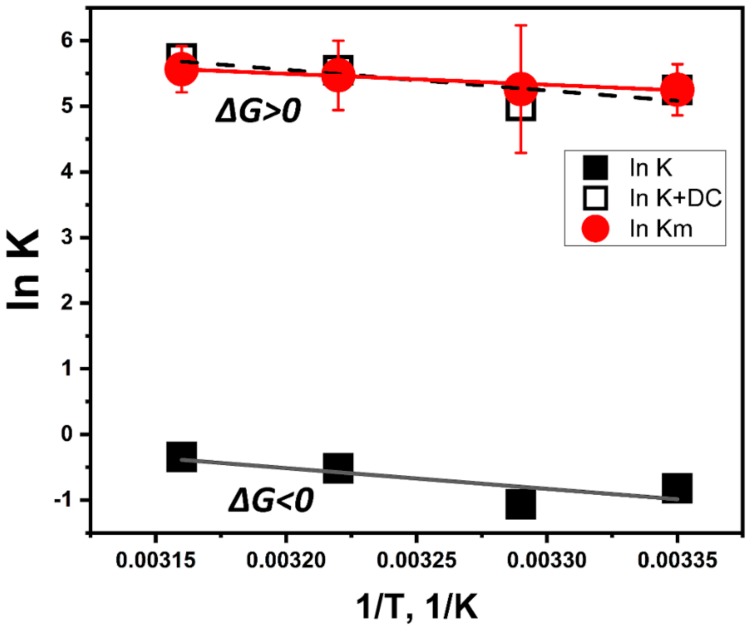
Figure 4.
Fitting of temperature-dependent kinetics and computational association data presented in a form of van ‘t Hoff graphs. Michaelis-Menten data shown by red solid circles with error bars and a red trendline. L-DOPA/tyrosinase association was modeled at different temperatures using molecular dynamics and docking simulations. The computational result is shown by black solid squares matched with a black solid line. The model of L-DOPA association was shifted to fit the kinetics data (red solid circles and dashes). The fit is demonstrated by the black open squares and dashes according to the equation: ln Km(1/T) = ln K(1/T) + DC, where DC is the dopachrome effect (DC = 6.07).

