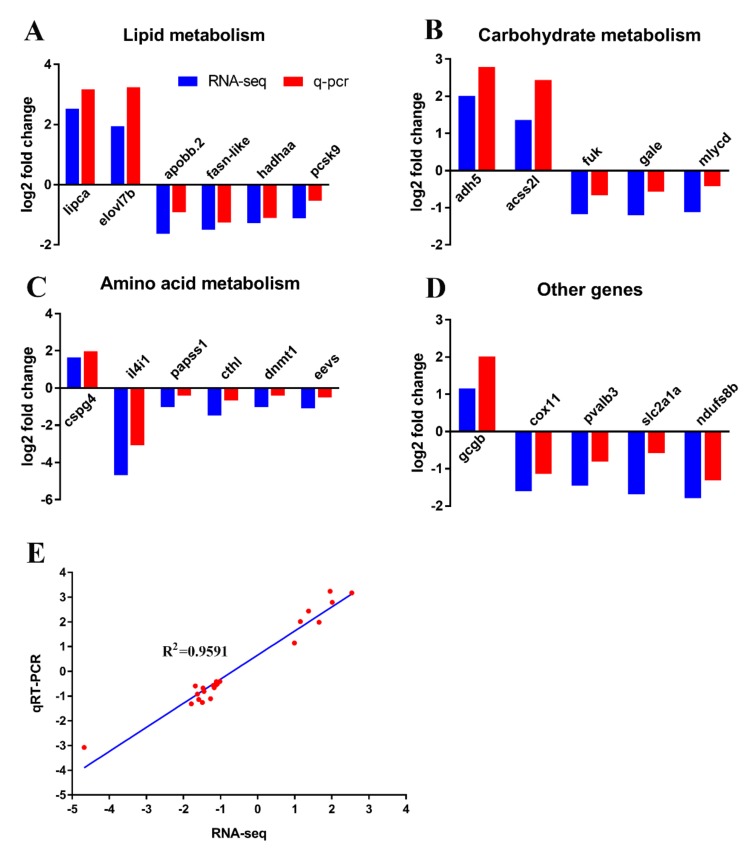
Figure 7.
Validation of RNA-seq data using qPCR. (A–D) The validation of the expression levels of differentially expressed genes by qRT-PCR analysis in the categories of lipid metabolism (A) carbohydrate metabolism, (B) amino acid metabolism, (C) and other DEGs (D). (E) Correlation between qRT-PCR and RNA-seq results for select DEGs. The log2 (fold change) values derived from the RNA-seq analysis of DEGs are compared with those obtained by qRT-PCR determined by 2−ΔΔCT. The reference line indicates the expected linear relationship.

