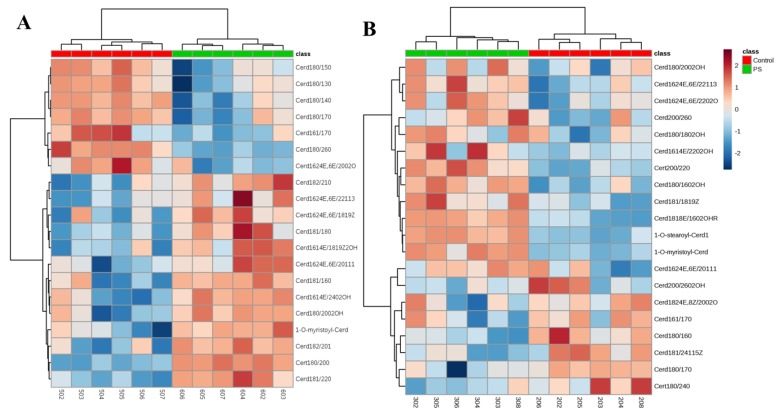
Figure 5.
Two-dimensional hierarchical clustering heat map of the 20 CERs selected according to the VIP list in the keratinocytes (A) and fibroblasts (B). Relative abundance levels are indicated on the colour scale, with numbers indicating the fold difference from the overall average. The clustering of the sample groups is represented by the dendrogram at the top. The clustering of individual CER species with regard to their similarity in the change of relative abundance is represented by the dendrogram on the left.

