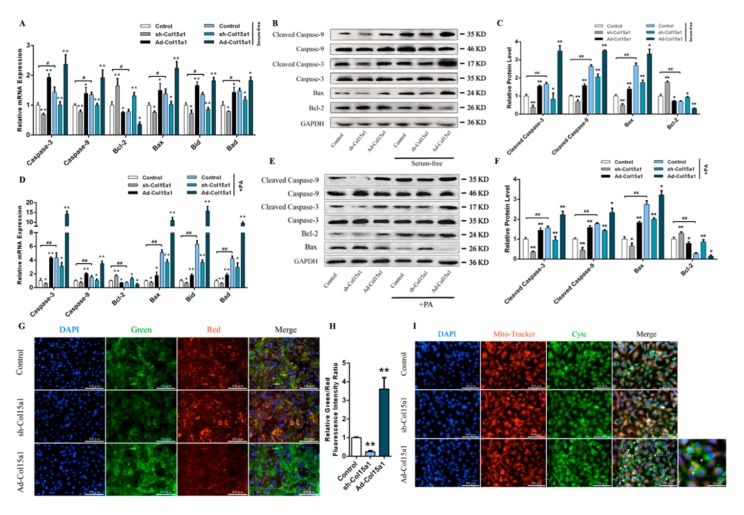
Figure 2.
ColXV exacerbated apoptosis in unfavorable state adipocytes and involved a mitochondrial pathway. (A–C) Relative mRNA and protein expressions of Caspase-3/Cleaved Caspase-3, Caspase-9/Cleaved Caspase-9, Bax, Bcl-2, Bid, and Bad in mice adipocytes in the Control group, sh-Col15a1 group and Ad-Col15a1 group with or without FBS (Fetal Bovine Serum) treatment (n = 4). (D–F) Relative mRNA and protein expressions of Caspase-3/Cleaved Caspase-3, Caspase-9/Cleaved Caspase-9, Bax, Bcl-2, Bid, and Bad in mice adipocytes in the Control group, sh-Col15a1 group and Ad-Col15a1 group with or without PA (palmitate) treatment (n = 4). (G–H) JC-1 staining of mitochondrial membrane potential in adipocytes. Scale bar, 100 μm (n = 4). (I) Representative images and enlarged image (bottom right) of Mito-tracker staining (Red) and Cytc (Cytochrome C) immunofluorescent staining (Green) in adipocytes in different groups. Scale bar, 100 μm (n = 4). Arrowheads indicate Cytc released from mitochondria to the cytoplasm. Scale bar, 20 μm. Values are presented as mean ± SEM. *p < 0.05, ** p < 0.01.

