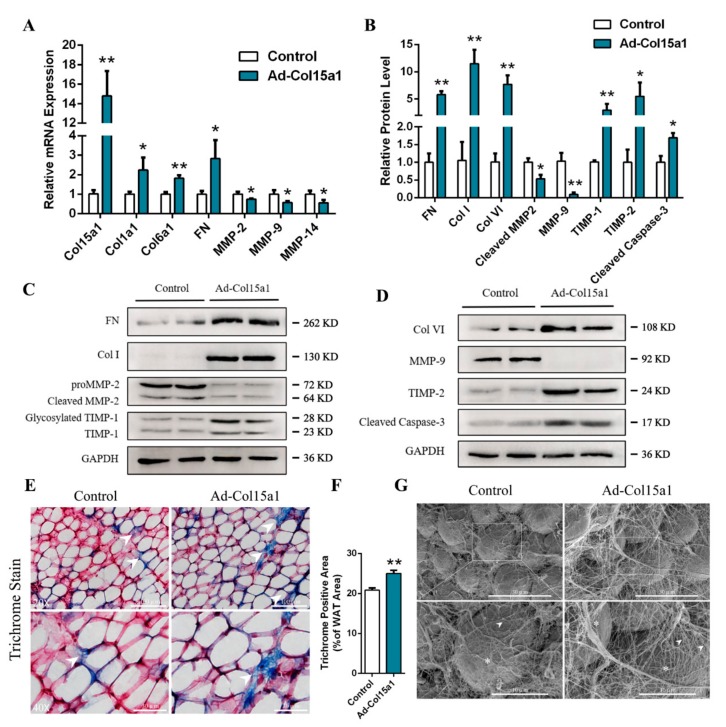
Figure 4.
ColXV raised excessive deposition of ECM composition in WAT. All mice were pretreated with either Ad-GFP or Ad-Col15a1. (A) Relative mRNA expressions of Col15a1, Col1a1, Col6a1, Fibronectin, MMP-2, MMP-9 and MMP-14 in mice inguinal white adipose tissue (iWAT) (n = 6). (B–D) Relative protein expressions of Fibronectin, Col I, Col VI, MMP-2, MMP-9, TIMP-1, TIMP-2 and Cleaved Caspase-3 in mice iWAT (n = 6), each group has two technical repeats. (E–F) Representative images of Masson’s trichrome staining (collagen is shown as blue, nuclei as black and cytoplasm as red) in frozen-section iWAT samples. Scale bar, 100 μm (top) and 30 μm (bottom) (n = 4). Arrowheads indicate thinner collagen fibers (left) and thicker collagen fibers (right). (G) Representative images of collagen bundles microstructure on adipocytes surface by scanning electron microscope. Scale bar, 30 μm (top) and 10 μm (bottom) (n = 4). Arrowheads indicate thinner collagen bundles (left) and thicker collagen bundles (right). Asterisks indicate adipocytes. Values are presented as mean ± SEM. *p < 0.05, ** p < 0.01.

