Figure 6.
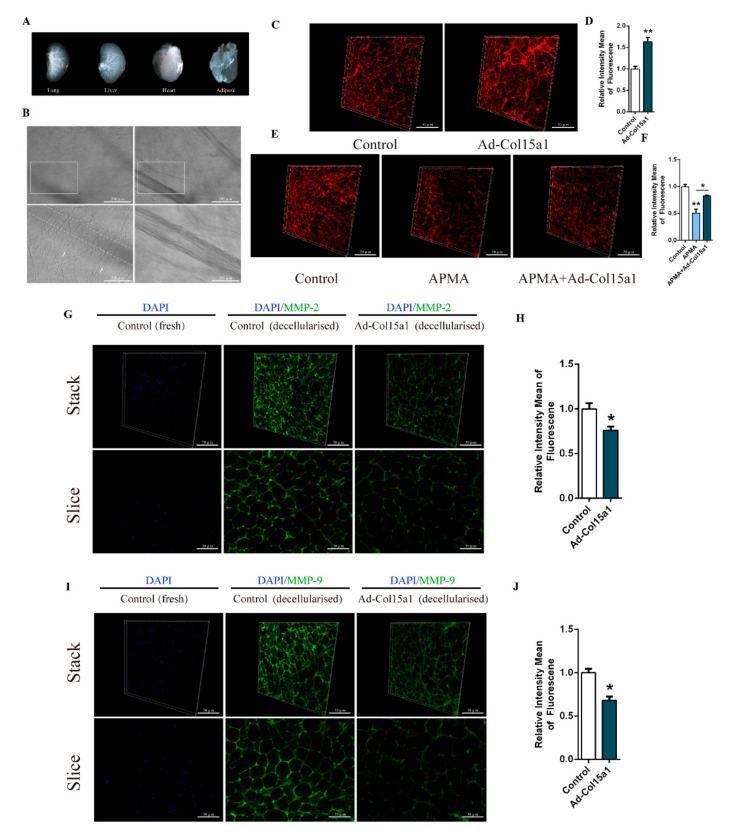
Z-stack analysis and three-dimensional reconstruction of adipose tissue ECM under decellularized conditions. (A) Images of decellularized lung, liver, heart and iWAT. (B) Representative images of ECM structural integrity and transparency detection in decellularized iWAT. Scale bar, 100 μm (top) and 30 μm (bottom) (n = 4). White rectangle represents the images of different focal lengths at the same position (left and right). Arrowheads indicate collagen bundles and right images indicate complete microvascular structure in decellularized iWAT. (C–D) Representative images of the 3-dimensional structure by Col I immunofluorescent staining of two different groups in decellularized iWAT. Scale bar, 50 μm (n = 4). (E–F) Representative images of the 3-dimensional structure by Col VI immunofluorescent staining of three different groups in decellularized iWAT. Scale bar, 50 μm (n = 4). (G–H) Representative images of the 3-dimensional structure by MMP-2 immunofluorescent staining and DAPI staining of two different groups in decellularized iWAT (two columns on the right). DAPI staining in un-decellularized iWAT(left). Scale bar, 50 μm (n = 4). Slice (bottom) represents one of the images composed of the Stack. Scale bar, 30 μm (n = 4). (I–J) Representative images of the 3-dimensional structure by MMP-9 immunofluorescent staining and DAPI staining of two different groups in decellularized iWAT (two columns on the right). DAPI staining in un-decellularized iWAT(left). Scale bar, 50 μm (n = 4). Slice (bottom) represents one of the images composed of the Stack. Scale bar, 30 μm (n = 4). Values are presented as mean ± SEM. *p < 0.05, ** p < 0.01.

