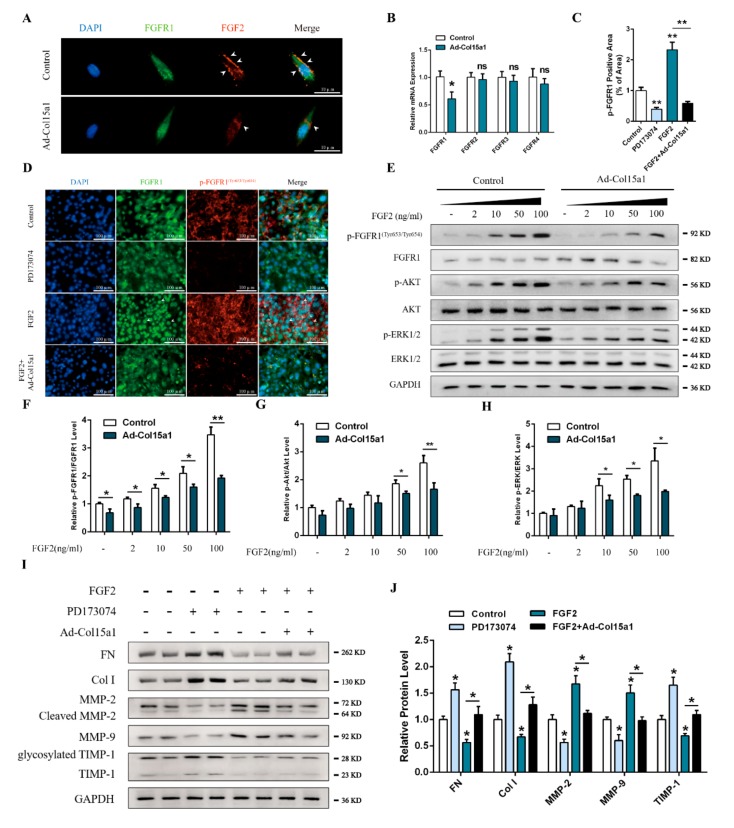
Figure 7.
ColXV promoted ECM deposition in adipose tissue via fibroblast growth factor 2 (FGF2)/ fibroblast growth factor receptor 1 (FGFR1) axis. (A) Representative images of adipocytes in different groups stained by FGFR1 (green) and FGF2 (red). Arrowheads indicate FGF2 enriched to the cell membrane. Scale bar, 10 µm. (B) Relative mRNA levels of FGFR1, FGFR2, FGFR3, and FGFR4 of adipocytes in different groups (n = 4). (C-D) Representative images of adipocytes in different groups were stained by FGFR1 (green) and p-FGFR1Tyr653/Tyr654(red). Arrowheads indicate FGFR1 transferred into the nucleus. Scale bar, 100 µm (n = 4). (E–H) Relative protein phosphorylation levels of FGFR1Tyr653/Tyr654, AKT, and ERK1/2 of two groups in adipocytes with gradients concentration of FGF2 (n = 4). (I–J) Relative protein levels of FN, Col I, MMP-2, MMP-9, and TIMP-1 of adipocytes in different groups (n = 4). Values are presented as mean ± SEM. *p < 0.05, ** p < 0.01, ns, not significant.

