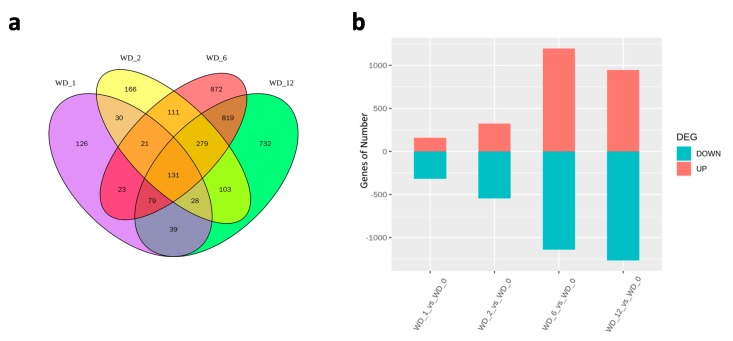
Figure 4.
Analysis of differentially expressed genes in response to heat stress. (a) Venn diagram analysis of significantly differentially expressed genes at the four heat stress time points. (b) Numbers of significantly regulated genes at the four heat stress time points. Red and green columns represent the number of up- and down-regulated genes at different heat stress time points, respectively.

