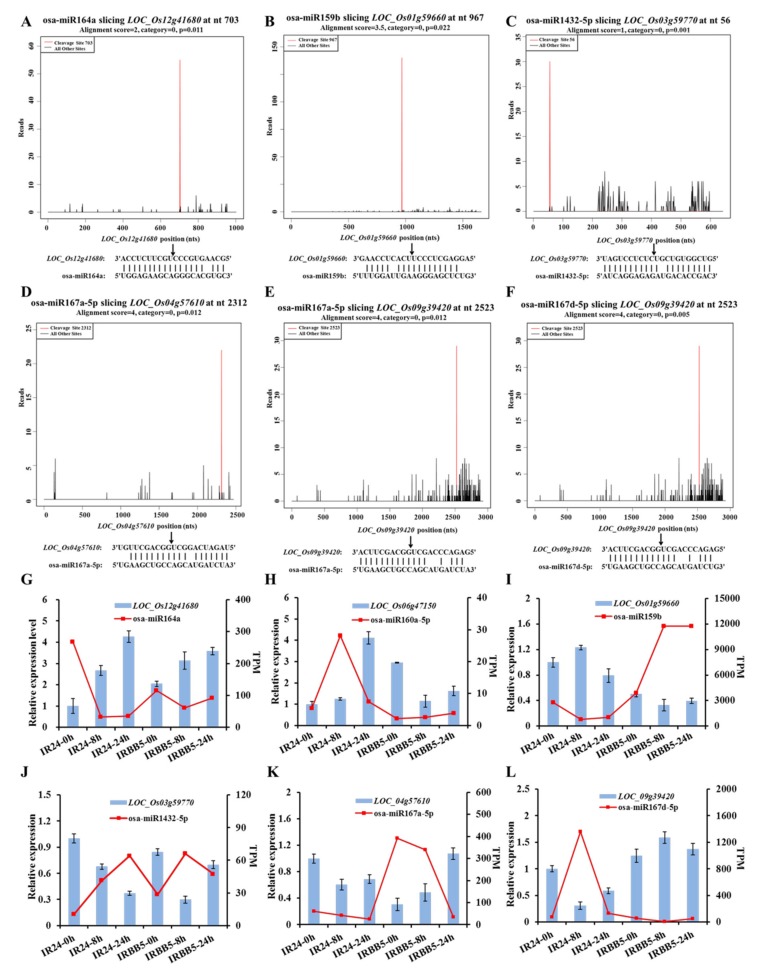
Figure 6.
The negative correlation identification of miRNA and target genes. (A–F) Target plots (T-plots) of representative miRNA targets validated by degradome sequencing. The red lines showed the distribution of the degradome tags along the target mRNA sequences. The black arrows represented the cleavage sites of miRNAs on the target genes. (G–L) The relative expression levels of miRNA and targets at different time points in Xoo-infected IRBB5 and IR24. The histogram and red dot indicate the expression levels of targets from quantitative reverse transcriptase-polymerase chain reaction (qRT-PCR) analysis and miRNA sequencing data, respectively.

