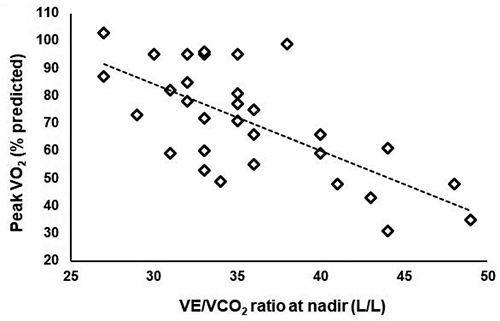
Figure 3.

Relationship between peak exercise capacity and the carbon dioxide equivalent at nadir during cardiopulmonary exercise test. VO2, oxygen consumption; VCO2, carbon dioxide output; VE, Ventilation. Spearman’s r= -0.658, p<0.01, 43% of the variation explained.
