Figure 2.
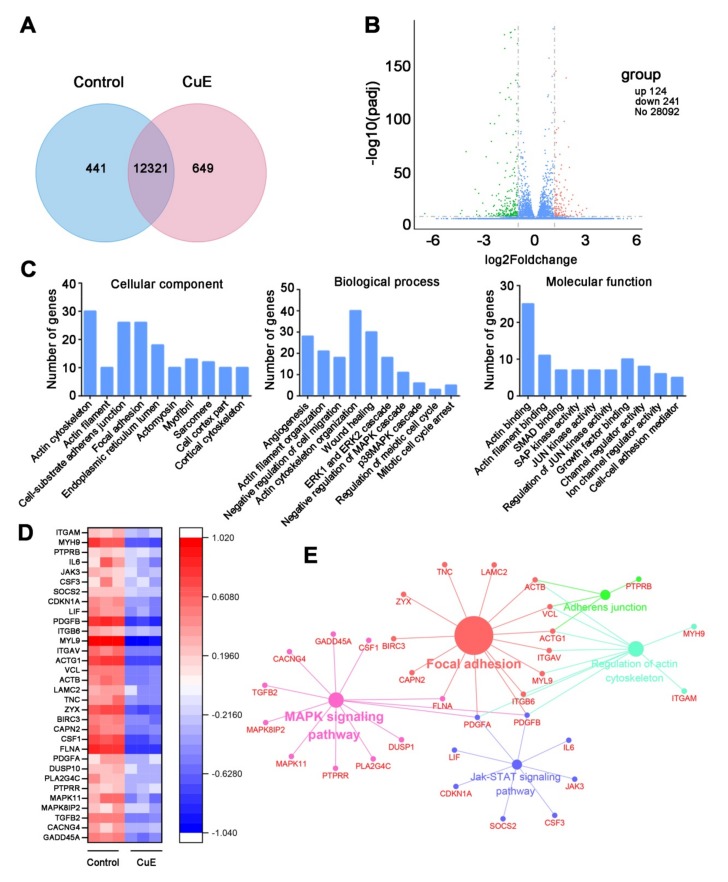
RNA-seq analysis for CuE-altered genes. Cells were treated with vehicle, or 40 nM of CuE for 24 h, respectively. (A) Venn diagram showing numerical distribution of differentially expressed genes in HUh7 cells. (B) The volcano of differentially expressed genes. (C) Genes significantly down-regulated by CuE were classified into different CCs, BPs, and MFs. (D) Heat map of down-regulated genes involved in significantly canonical pathways after treatment with CuE in Huh7 cells. (E) KEGG pathway enrichment analysis for the significantly down-regulated gene predicted the significantly canonical pathways.

