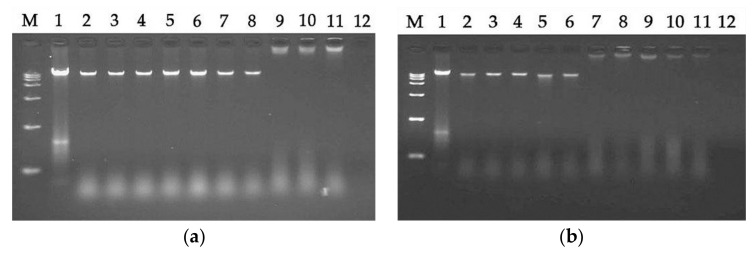
Figure 7.
A gel retardation experiment was used to measure the DNA binding assay: (a) LRpG-treated; (b) LRα-treated. M: DNA marker alone; 1: genomic DNA alone; 2: with 0.5 μM peptide; 3: with 1 μM peptide; 4: with 2 μM peptide; 5: with 4 μM peptide; 6: with 8 μM peptide; 7: with 16 μM peptide; 8: with 32 μM peptide; 9: with 64 μM peptide; 10: with 128 μM peptide; 11: with 256 μM peptide; 12: 256 μM peptide alone.

