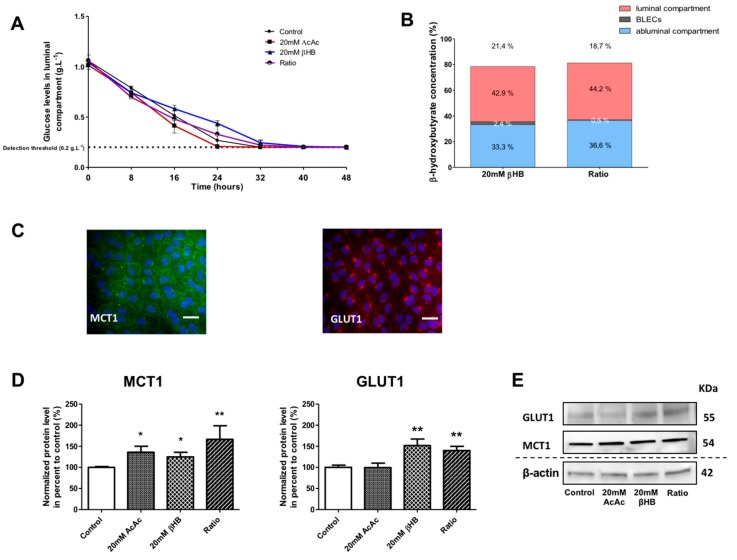
Figure 2.
Effect of KBs on the human in vitro BBB model. (A) BLECs were incubated with various concentrations of KBs for 48 h: 20 mM AcAc, 20 mM βHB, or ratio (20 mM AcAc/20 mM βHB). The glucose concentration was measured in the apical compartment every 8 h. (B) The βHB concentration was measured in the apical and basolateral compartments and in BLECs. The data are represented as mean ± SEM obtained from three independent experiments. (C) The presence of MCT1 (green) and GLUT1 (red) in the BLECs was performed using immunostaining. Nuclei were stained with Hoechst reagent, and appear in blue. Scale bar: 50 µm. (D) The effects of KBs on MCT1 and GLUT1 protein levels were analyzed by Western blot. The protein level was normalized using β-actin. The protein data represent the mean ± SEM obtained from at least three independent experiments relative to control conditions (* p < 0.05, ** p < 0.01). (E) The images are representative of at least three independent experiments.

