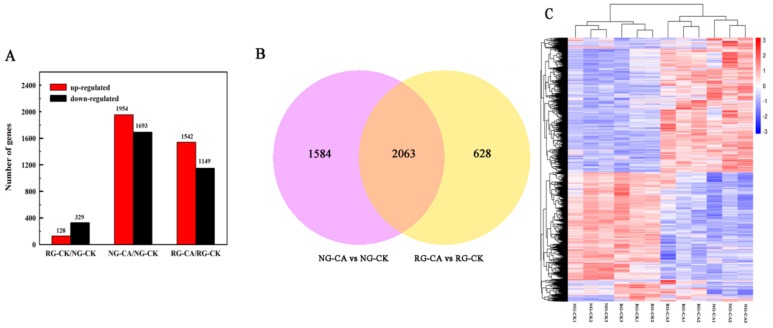
Figure 3.
Number of significantly different differentially expressed genes (DEGs) among the libraries. (A). Number of up- and down-regulated DEGs among RG and NG cucumber seedlings exposure to 0 mM (CK) and 0.5 mM cinnamic acid treatment (CA) libraries. (B). Venn diagram of DEGs under the control and CA stress conditions. Significant difference of DEGs was expressed at the two criterions of |log2FoldChange| > 1 and Padj < 0.05. (C). Cluster analysis of DEGs among 12 samples using hierarchical clustering method. Expression of the same gene among different samples was shown in the horizontal direction. Red color represents high expression and blue color represents low expression.

