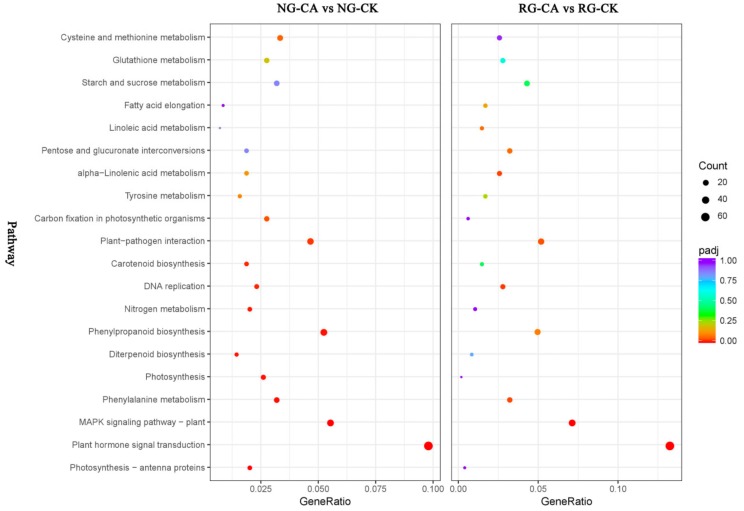
Figure 5.
Top 20 of KEGG pathway maps of DEGs in RG and NG libraries after cinnamic acid stress compared to their respective control. The x-axis represents GeneRatio, which is the ratio of DEGs enriched to specific KEGG pathways to DEGs enriched to all KEGG pathways. The y-axis represents the KEGG pathways. The color closer to red of spot represents a higher significance of DEGs. Bigger size of spot represents more DEGs enriched.

