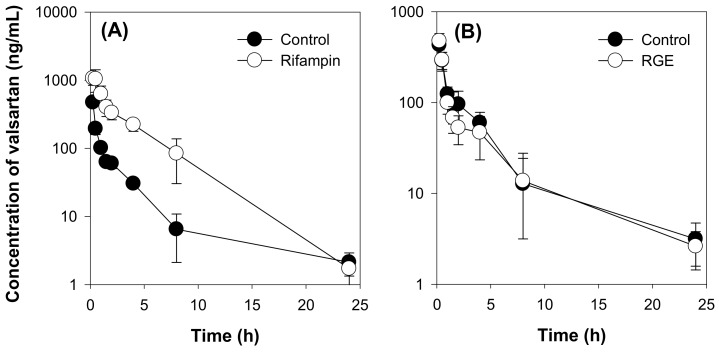
Figure 5.
(A) Plasma concentration-time profile of valsartan in the control and rifampin (20 mg/kg) groups following intravenous injection of valsartan at a dose of 1 mg/kg in rats. (B) Plasma concentration-time profile of valsartan in the control and red ginseng extract (RGE, 1.5 g/kg/day for 7 days) groups following intravenous injection of valsartan at a dose of 1 mg/kg in rats. Data points represent the mean ± SD of four different rats per group.

