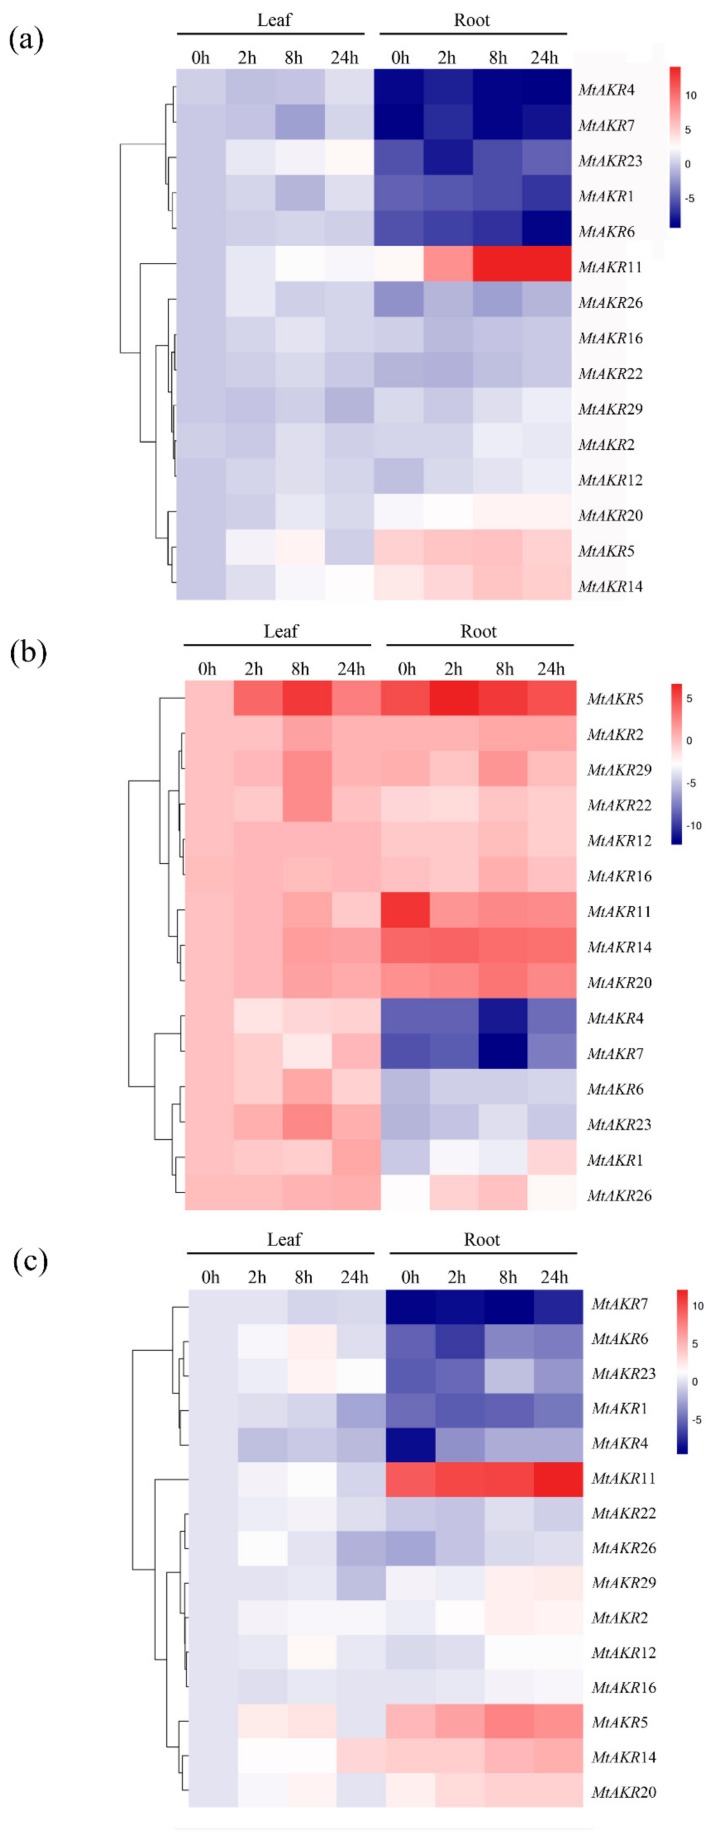
Figure 6.
Hierarchical clustering and heatmap representation of leaf and root MtAKR genes expression profiles in ABA (a), PEG (b), and NaCl (c) conditions. The data obtained by quantitative RT-PCR correspond to the levels of MtAKRs in total RNA samples extracted from leaves and roots (four technical replicates). The expression levels of genes were used 2−ΔΔCt, and the heatmap was presented in log2 values.

