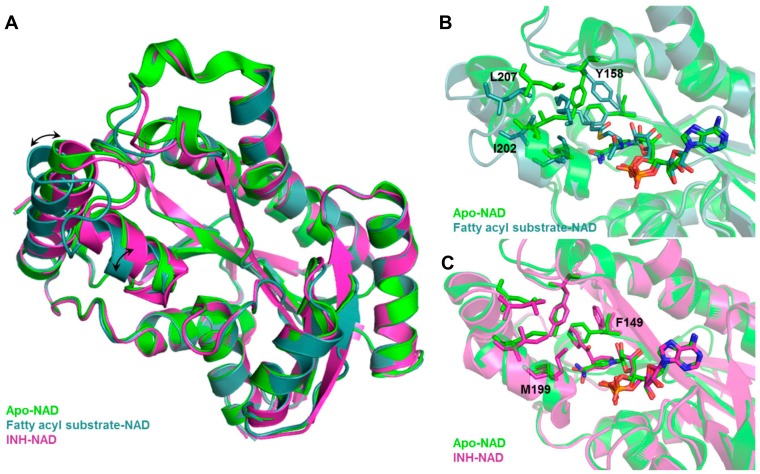
Figure 3.
Backbone and sidechain flexibility shown by Mtb InhA, apo vs. fatty acyl-bound vs. INH-bound. (A) Structural overlay of apo, fatty acyl-bound, INH-bound Mtb InhA shows backbone movement upon substrate (fatty acyl) binding. Binding site comparison of (B) fatty acyl-bound and (C) INH-bound vs. apo Mtb InhA structure shows distinct changes in residue side chain positions and conformations. Black arrows indicate movement of alpha helices, side chains that showed large conformational change upon fatty acyl or INH binding are labelled in black.

