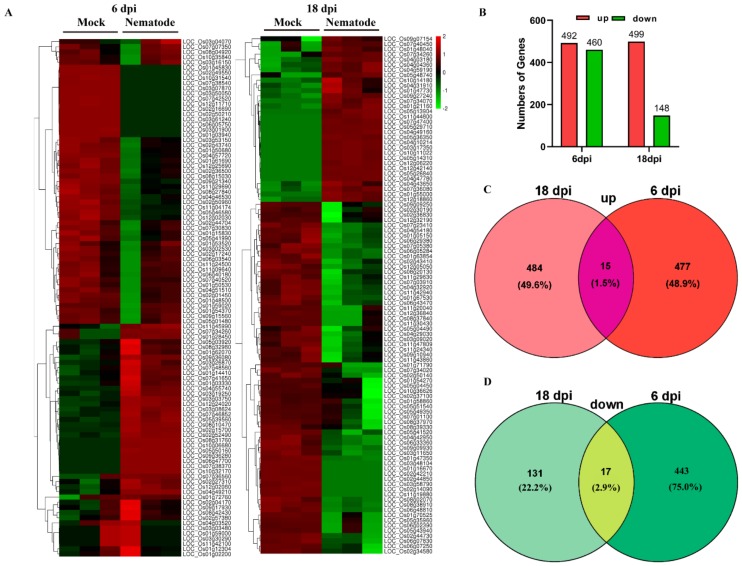
Figure 2.
Differentially expressed genes (DEGs) induced by root-knot nematodes at 6 and 18 dpi. (A) Cluster heat map showing the level of expression of differential genes; (B) Up- and downregulated genes; (C) Venn diagrams showing intersection of genes that were upregulated at either 6 or 18 dpi; (D) Venn diagrams showing intersection of genes that were downregulated at either 6 or 18 dpi.

