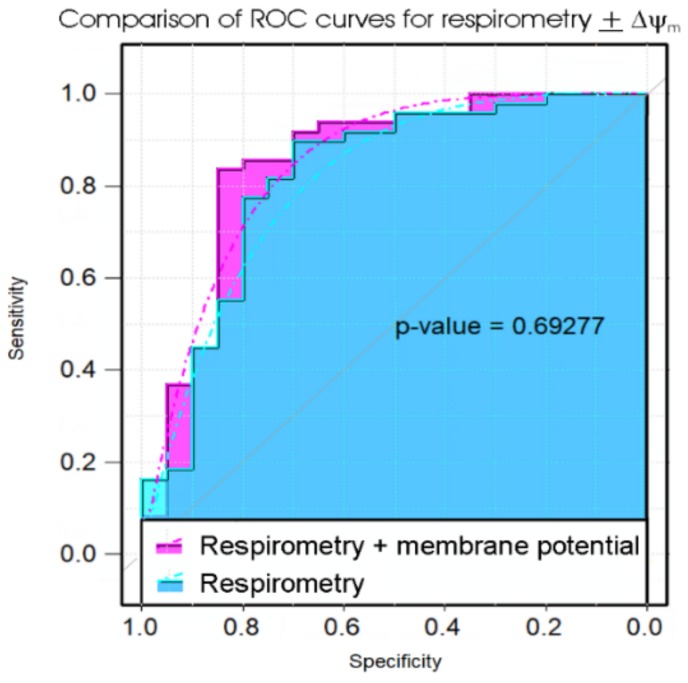
Figure 3.
Comparison of ROC curves of propensity scores in logistic regression of five key parameters of lymphoblast respiration with or without measures of the mitochondrial membrane potential. The significance probability of a bootstrap test of the difference between the ROC curves (Robin et al., 2011) is indicated [36]. The addition of the extra laboratory assay (for mitochondrial membrane potential, ΔΨm) did not significantly improve the diagnostic value of the test.

