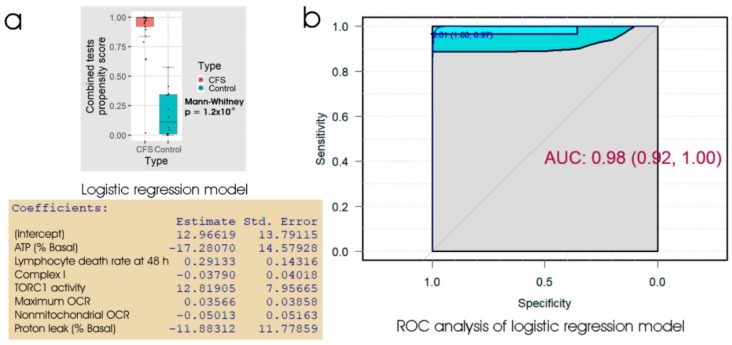
Figure 6.
Logistic regression and ROC analysis of combined tests for lymphocyte death in culture, lymphoblast respiration and lymphoblast TORC1 activity. (a) Box plot showing the distribution of the propensity score from logistic regression of the percentage of dead lymphocytes after 48 h in culture, 5 key parameters of lymphoblast respiration and the TORC1 activity. The resulting regression coefficients were as indicated. The boxes show the median and the 25th and 75th percentiles, so that the height of the box is the interquartile range (IQR). The whiskers extend to the most extreme observations (largest and smallest) falling within ± 1.5 × IQR of the box. The Mann–Whitney significance probability tests the hypothesis, that the scores in ME/CFS samples are greater than in control samples. Each point represents a single individual. Scores greater than 0.5 lead to classification of a sample as ME/CFS in the “confusion matrix”. Other relevant statistics showing that the logistic regression model provided a good fit to the data were: Hesmer–Lemeshow goodness of fit = 0.77; Pseudo R2 = 0.87; χ2 p = 2.9 × 10⁻⁶. (b) ROC analysis of the propensity score, plotting sensitivity (proportion of true positives) against specificity (proportion of true negatives) with 95% confidence limits (cyan shading). The fractional area under the curve (AUC) is shown with 95% confidence limits. The “best” threshold for the propensity score (0.61) is shown, together with the specificity (1.0) and sensitivity (0.97) at that threshold (in parentheses).

