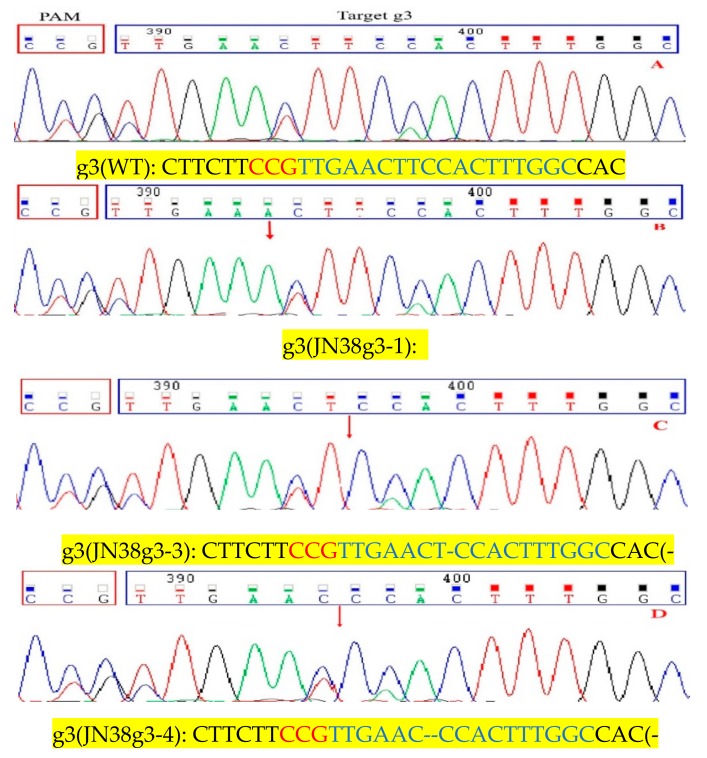
Figure 1.
Analyses of sequencing chromatogram data of the target mutant sites of g3. (A) Sequences of wild type and representative mutation types induced at target site g3 are presented, respectively. Underline, insertions. Dashes, deletions. (B–D) are sequence peaks of wild type and representative mutation types at target site g3, respectively. The red arrowheads indicate the location of mutations.

