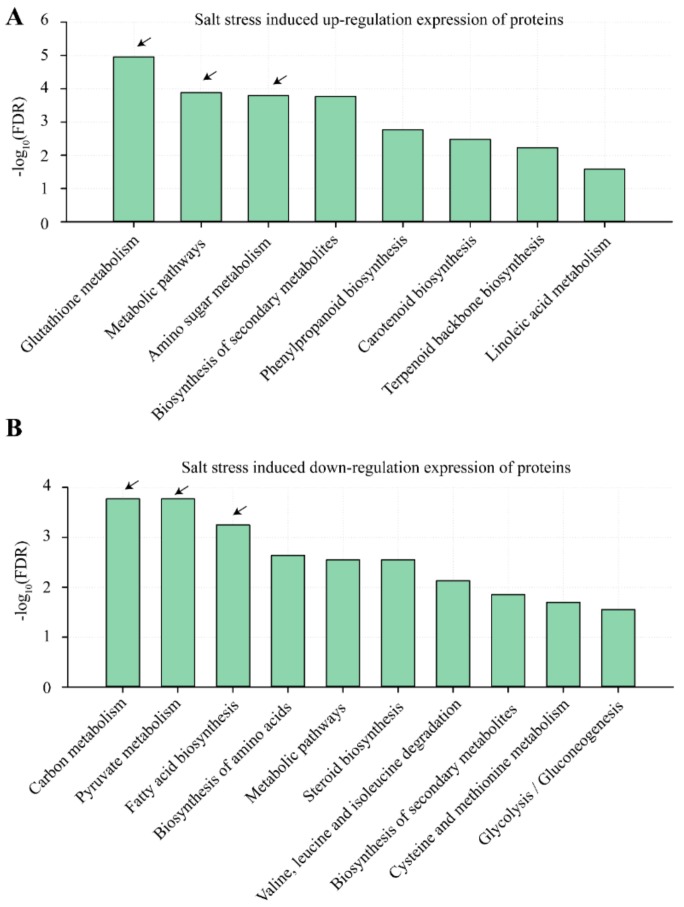
Figure 5.
Gene ontology (GO) analysis on salt stress induced up-/down-regulation of expressed proteins. Panels (A,B) represent up-/down-regulation of proteins induced by 200 mM NaCl treatments in alfalfa seedlings during 14 d. The arrow represents the key biological pathways highlighted in this study. FDR means false discovery rate.

