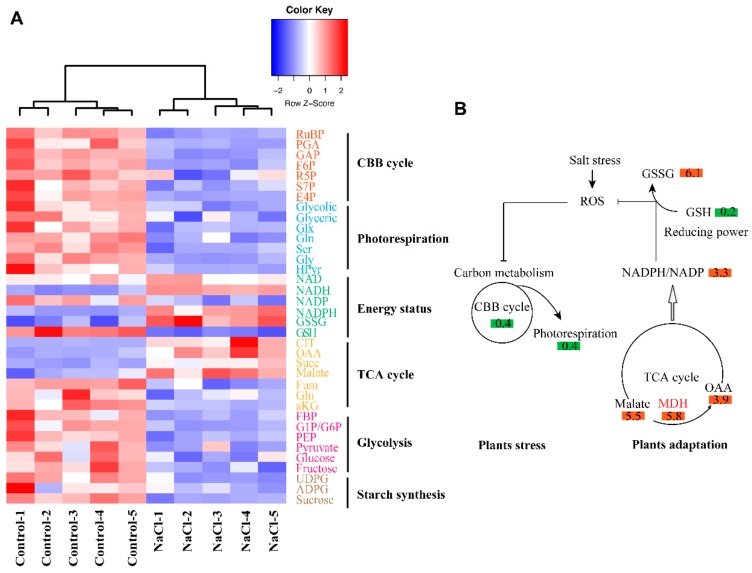
Figure 8.
Metabolic reprogramming in alfalfa in response to salt stress. (A) Hierarchical clustering heatmap represents the metabolites related to different metabolic pathways in alfalfa seedlings enduring 200 mM NaCl for 14 d. The heatmap based on the identified protein abundance levels was created using Gene Cluster 3.0 software with the Euclidean distance similarity metric and linkage method. The resulting clusters were visualized using Java TreeView software. (B) A proposed model displays the triggering of ROS scavenging in alfalfa plants ascribed to the NADPH reducing power generated following conversion of malate to OAA (Oxaloacetate) in the TCA cycle as an adaptation strategy to salt stress. The numbers displayed in the boxes represent the ratio of metabolites under salt stress against control conditions (Salt/Ctrl), while green and red boxes represent down- and up-regulation of metabolic response in alfalfa to salt stress, respectively.

