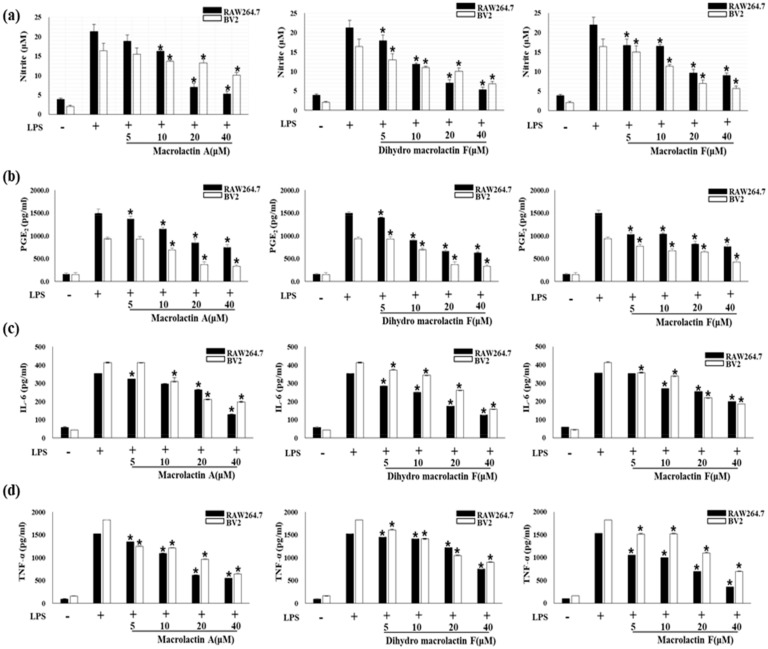
Figure 2.
Effect of MA, DMF and MF in LPS-stimulated RAW264.7 and BV2 cells on the production of NO (a), PGE2 (b), IL-6 (c) and TNF-α (d). Cells were pretreated for 2 h with indicated concentrations of MA, DMF, MF and stimulated for 24 h with LPS (1 μg/mL). Nitrite concentration, PGE2 assay were performed as described in section materials and methods. Values are expressed as mean ± S.D of three replicates. * p < 0.05 compared with LPS-treated group.

